8.1.2 Creating a PivotTable
Creating a PivotTable
Once you have a list in a worksheet, you can create a PivotTable. To do so, use the Worksheet s PivotTableWizard method. The PivotTableWizard method is extremely flexible (and therefore complex). However, to use data contained on a worksheet, only the first six parameters are necessary. The PivotTableWizard s pertinent syntax is as follows:
oSheet.PivotTableWizard( nSourceType, oSourceData, oTableDestination,
cTableName, lRowGrandTotals,
lColumnGrandTotals )
| nSourceType | Numeric | A numeric value that represents the kind of source data. The constant we ll discuss here is xlDatabase (1). Other constants are xlConsolidation (3), xlPivotTable (-4148), and xlExternal (2). |
| oSourceData | Object | A Range object that contains the data for the PivotTable. |
| oTableDestination | Object | A Range object that contains the location of the PivotTable (you can specify just the upper-left cell; you don t have to figure out the size). |
| cTableName | Character | The name of the table. |
| lRowGrandTotals | Logical | Indicates whether grand totals for rows should be included (most useful only if multiple row fields are used). |
| lColumnGrandTotals | Logical | Indicates whether grand totals for columns should be included (most useful only if multiple column fields are used). |
Here s the source to add a PivotTable to the preceding spreadsheet, beginning at cell J1:
#DEFINE xlDatabase 1
oSourceData = oBook.Sheets[1].Range("A1:H2822")
oDestination = oBook.Sheets[1].Range("J1")
oPivotTable = oBook.Sheets[1].PivotTableWizard(xlDatabase, oSourceData, ;
oDestination, "SalesAnalysis", .T., .T.)
After the PivotTableWizard method is run, the range J1:K2 is highlighted by bold, blue borders. What has been accomplished is that a PivotTable object has been created. Unlike most Wizard methods that produce a finished object, the PivotTableWizard method generates a blank object, which needs more programming to finish it.
The PivotTableWizard doesn t contain parameters for populating the PivotFields collection, which is the collection of all the fields used in the PivotTable. That s okay by us, as we can t imagine how complex the syntax would be! Use the AddFields method of the PivotTable object, which has the following syntax:
oPivotTable.AddFields( cRowField, cColumnField, cPageField, lAddFields )
| cRowField | Character | The name of the field used to generate the rows of the PivotTable. The field name is a character string that matches the column label in the first row of the list. (Optional) |
| cColumnField | Character | The name of the field used to generate the columns of the PivotTable. (Optional) |
| cPageField | Character | The name of the field used to generate the pages of the PivotTable. Think of pages as a filtered view rather than a tabbed page. Pages are selected from a drop-down list at the top of the PivotTable. (Optional) |
| lAddFields | Logical | Indicates whether to add the fields to any existing fields (.T.) or replace the fields that are contained in the PivotTable (.F.). The default is false. (Optional) |
As an example, set the rows to the country field and the columns to the category name with the following code:
oPivotTable.AddFields("country", "category_name")
This command sets the RowField and ColumnField to the country and category_name fields. A data field to summarize has not been set. This is accomplished by accessing the appropriate PivotField object directly. The PivotFields collection is generated when the PivotTableWizard method is run, and it contains one object for each field. The PivotTable s AddFields method uses the listed field names, and sets certain properties of the appropriate PivotField objects to indicate that the fields are used for RowFields or ColumnFields. One of the more than 50 properties for a PivotField object is the Orientation property, which determines the location of the field within the PivotTable. Set the Orientation property to one of the following values: xlColumnField (2), xlDataField (4), xlHidden (0), xlPageField (3), or xlRowField (1). To summarize the quantity field, give the following commands:
#DEFINE xlDataField 4
oPivotTable.PivotFields["Quantity"].Orientation = xlDataField
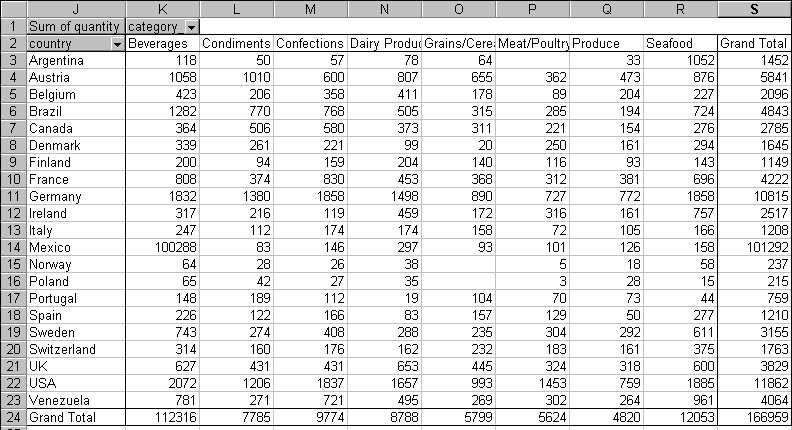
The resulting PivotTable is shown in Figure 2. It only took about a second and a half to create it on Della s test machine (after the data was built). Note that the row and column field labels are dropdowns. This interactive feature lets your users select which columns or rows to display. For example, they can choose only the Beverages and Confections categories for USA, Canada, and Mexico. To do so, the user clicks on the dropdown and then checks those items in the list he d like to see.
You can accomplish this in code, by manipulating the PivotField object s PivotItems collection. Each PivotField has a collection of PivotItems, each correlating to a row or column. The heading labels are used as the index name. One of the 19 properties of the PivotItem object is the Visible property. Setting Visible to .F. removes it from the view. The following code leaves visible only the Beverages and Confections columns for North American countries.
WITH oPivotTable.PivotFields("category_name")
.PivotItems("Condiments").Visible = .F.
.PivotItems("Dairy Products").Visible = .F.
.PivotItems("Grains/Cereals").Visible = .F.
.PivotItems("Meat/Poultry").Visible = .F.
.PivotItems("Produce").Visible = .F.
.PivotItems("Seafood").Visible = .F.
ENDWITH
WITH oPivotTable.PivotFields("country")
.PivotItems("Argentina").Visible = .F.
.PivotItems("Austria").Visible = .F.
.PivotItems("Belgium").Visible = .F.
.PivotItems("Brazil").Visible = .F.
.PivotItems("Denmark").Visible = .F.
.PivotItems("Finland").Visible = .F.
.PivotItems("France").Visible = .F.
.PivotItems("Germany").Visible = .F.
.PivotItems("Ireland").Visible = .F.
.PivotItems("Italy").Visible = .F.
.PivotItems("Norway").Visible = .F.
.PivotItems("Poland").Visible = .F.
.PivotItems("Portugal").Visible = .F.
.PivotItems("Spain").Visible = .F.
.PivotItems("Sweden").Visible = .F.
.PivotItems("Switzerland").Visible = .F.
.PivotItems("UK").Visible = .F.
.PivotItems("Venezuela").Visible = .F.
ENDWITH

Figure 2
. A simple PivotTable. In just a few lines of code, a simple cross-tab has been generated. Note the dropdowns for the Country and Category_Name your users can have a great time customizing the data.As you can see, you need to address every item individually, which means you need to know your data well. But because the resulting PivotTable is completely interactive, perhaps your users may want to manipulate the fields in Excel, rather than having you write a major front end to the PivotTable.
Using a FOR EACH loop to spin through all the PivotItems can make life a bit easier. Check the value of the PivotItem s Name field to determine whether to set the Visible property. The following code produces the same results as the preceding sample code:
FOR EACH oItem IN oPivotTable.PivotFields("category_name").PivotItems
IF NOT oItem.Name $ ("Beverages Confections")
oItem.Visible = .F.
ENDIF
ENDFOR
FOR EACH oItem IN oPivotTable.PivotFields("country").PivotItems
IF NOT oItem.Name $ ("Canada Mexico USA")
oItem.Visible = .F.
ENDIF
ENDFOR
Let s get a little more complicated with the PivotTable. To make this PivotTable summarize the Total_Price field, use the following:
#DEFINE xlDataField 4
oPivotTable.PivotFields["Total_Price"].Orientation = xlDataField
Figure 3
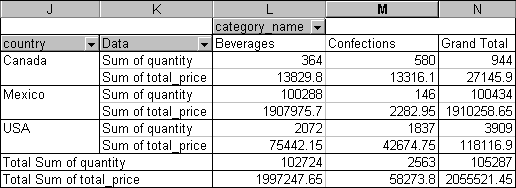
shows the results (now you can see why we removed a lot of the rows and columns so we can show a reasonably sized example!). In fact, you can have any number of DataFields. Setting the Orientation property for a PivotField does not affect any other PivotField s status.
Figure 3
. Things get a little more complex. We ve turned Visible off for a number of rows and columns and added a second DataField.Those Total_Price values need a little formatting to look like currency. You can set the formatting for an entire PivotField using the PivotField object s NumberFormat property (this is covered in Chapter 7, "Excel Basics" the codes you need are listed in Table 2 in that chapter). Changing the numeric format to currency works like this:
oPivotTable.PivotFields["Sum of Total_Price"].NumberFormat = "$###,###,###.#0"
Note that the field name changes for a summary value. This is because you might have two different calculations for the same field. For example, we can add an average total price field. First we ll set the orientation of the Total_Price field again this adds a second instance of a summary data field. Its default name is "Sum of Total_Price2." Changing the name also changes the display label, so that should be the next step, then actually setting the function is the last step. Set the Function property to one of the constants shown in Table 1.
Table 1
. Function property values. The Function property controls how the DataField is calculated.| Constant | Value | Constant | Value |
| xlAverage | -4106 | xlStDev | -4155 |
| xlCount | -4112 | xlStDevP | -4156 |
| xlCountNums | -4113 | xlSum | -4157 |
| xlMax | -4136 | xlVar | -4164 |
| xlMin | -4139 | xlVarP | -4165 |
| xlProduct | -4149 |
The code to add a third summary field and set it to the average of the Total_Price field is as follows:
#DEFINE xlDataField 4
#DEFINE xlAverage -4106
* Add another Total_Price summary field
oPivotTable.PivotFields["Total_Price"].Orientation = xlDataField
* Change its name
oPivotTable.PivotFields["Sum of Total_Price2"].Name = "Average Total Sale
"* Set the formula to average the data, rather than sum the data
oPivotTable.PivotFields["Average Total Sale"].Function = xlAverage
* Format it so the numbers look like currency
oPivotTable.PivotFields["Average Total Sale"].NumberFormat = "$###,###,###.#0"
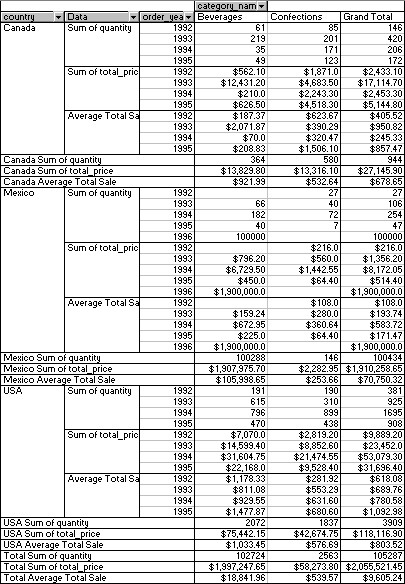
Now, to really see the power of PivotTables, you can add a second RowField. What s the purpose of a second field? To see each country s sales broken down by year. A picture s worth a thousand words here; the next line of code adds the Order_Year field as another RowField and combines with the previous examples to produce Figure 4.
#DEFINE xlRowField 1
oPivotTable.PivotFields["Order_Year"].Orientation = xlRowField
We ve just barely scratched the surface of PivotTables here. PivotTables are so complex, even Excel s VBA Help file has this remark in the "PivotTable Object" topic: "Because PivotTable report programming can be complex, it s generally easiest to record PivotTable report actions and then revise the recorded code." We concur; this is the only way to dive further into the complexities of this extremely rich feature of Excel.

Figure 4
. A complex PivotTable, with three DataFields and two RowFields. This only scratches the surface of what PivotTables can do.
Copyright 2000 by Tamar E. Granor and Della Martin All Rights Reserved
EAN: 2147483647
Pages: 128
- Step 1.2 Install SSH Windows Clients to Access Remote Machines Securely
- Step 3.1 Use PuTTY as a Graphical Replacement for telnet and rlogin
- Step 4.5 How to use OpenSSH Passphrase Agents
- Step 4.7 Using Public Key Authentication for Automated File Transfers
- Step 6.2 Using Port Forwarding Within PuTTY to Read Your E-mail Securely