Chapter 12: LAN Monitoring Tools
In previous chapters in this book, we discussed, described, and developed mathematical models that you could exercise to determine the performance of a local area network (LAN) or the wide area network (WAN) transmission facility used to connect two geographically separated LANs. The use of many of the models developed in this book depends on one or more frame or packet characteristics, such as the average frame length, the number of frames flowing to a particular station per unit time, or a similar metric. In prior chapters we assumed the information could be obtained. In this chapter we discuss and describe two network monitoring tools you can use to obtain detailed information that can be used as input to one or more models previously developed in this book.
12.1 EtherPeek
EtherPeek, a product of WildPackets (formerly known as the AG Group) of Walnut Creek, California, is a comprehensive protocol analyzer that operates at and above the data-link layer of the OSI Reference Model. This program includes a large number of features that enable statistics to be gathered concerning the flow of Ethernet frames as well as higher layer packets contained in the frames. Readers can download a trial copy of EtherPeek from the WildPackets Web site (http://www.wildpackets.com).
12.1.1 Operational Overview
Figure 12.1 illustrates the initial screen display of EtherPeek in its capture mode. Note that at the upper-left corner of the display, the number of bytes available is shown as 2,097,152, which in effect represents 2048 Kbytes. This represents the default buffer area used by EtherPeek for capturing data. While this may appear to represent a large amount of recording capability, as we will soon note this amount of memory can be rapidly filled by frames on a heavily utilized LAN. Fortunately, EtherPeek includes several mechanisms that enable you to focus your packet capturing effort on specific types of packets.
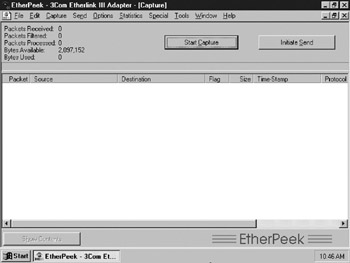
Figure 12.1: The EtherPeek Capture Screen Display
You can tailor EtherPeek in several ways to satisfy your data capture and analysis effort. One way to overcome the inability to capture more than a short period of activity on a heavily utilized LAN is to increase the size of the capture buffer. This can be accomplished by selecting the Capture Buffer option from the Capture menu. Figure 12.2 illustrates the display of the resulting Capture Buffer Options dialog box.
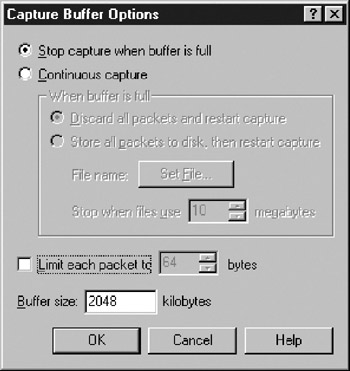
Figure 12.2: Use the Capture Buffer Options Dialog Box to Adjust the Size of Packets Captured and the Amount of Memory Used for Packet Capturing
12.1.1.1 Capture Buffer
In examining Figure 12.2, note that you can truncate the information captured for each packet by clicking on the box labeled "Limit each packet to." You can also adjust the buffer size from its default of 2048 Kbytes as well as select a continuous capture mode if you want to observe activity over a prolonged period of time on a heavily utilized LAN.
12.1.1.2 Filtering
Another technique you can use to control the capture of packets is to employ filtering, predefining specific types of packets you want captured. [*] An example is your LAN runs IP and NetWare, but because the latter is not routed to the Internet, you might want to limit statistics gathering to IP. By limiting the capture of packets to IP and defining a router IP address, you could significantly narrow the scope of packet capturing to determining the arrival rate of frames destined to the Internet. This would represent one of many general filtering methods you can employ through the use of the program's filtering capability. Now that we have a general appreciation for the use of filtering, let us examine some specific capabilities associated with the use of the program.
Figure 12.3 illustrates the EtherPeek Filters screen display resulting from the selection of the Filters option from the Capture menu. As indicated in the upper portion of the display, you can select packet filtering as one of three options. You can set the filter mode to ignore all filters, resulting in all packets being captured. As an alternative, you can set the filter mode so that only packets matching checked filters are captured (which is selected in Figure 12.3), or you can set the filter mode so that packets not matching checked filters are captured. The latter is equivalent to a boolean NOT operator.
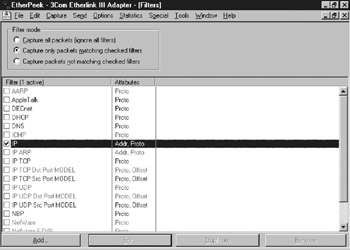
Figure 12.3: Use the EtherPeek Filters Screen to Control the Type Captured
Once you select the type of filters you want to employ for a specific protocol, you can further quantify filtering by either double-clicking on a selected protocol or clicking on the Add button. Either action results in the display of the dialog box labeled Filter Settings, which is shown in Figure 12.4.
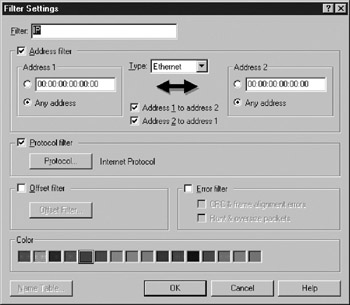
Figure 12.4: Use the Filter Settings Dialog Box to Set Values for up to Four Types of Filters
As indicated in Figure 12.4, through the use of the Filter Settings dialog box you can select a variety of filtering options to control the types of packets that will be captured. Concerning basic filtering options, you can select address, protocol, offset, and error filtering. Address filtering allows you to filter based on the type of address, such as Ethernet, AppleTalk, IP, and DecNet. You can effect filtering based on a specific address, pair of addresses, or any source or destination address. Although all Ethernet addresses are shown for the IP filter illustrated in Figure 12.4, you could select a specific Ethernet or IP destination address to examine the flow of packets to a router if you need such information to examine the potential effect of different WAN operating rates on the queuing system formed by a router and its WAN transmission facility.
The protocol filter provides the ability to select certain types of protocols to filter. Although IP was previously selected, you could use the protocol filter option to select a certain type of IP protocol such as the Address Resolution Protocol (ARP). The offset filter option provides the ability to move to a specific location within a packet and specify the value of data for the filter matching criteria. The fourth type of filter is the error filter. As indicated in Figure 12.4, for Ethernet filtering, the program's error filter options include CRC and frame alignment errors and run and oversize packets.
12.1.1.3 Packet Capture
After selecting your filters and possibly modifying the default buffer settings, you are ready to initiate a packet capturing session. An example of a packet capturing session in which only IP packets are captured based on the previously shown general filter that was created is illustrated in Figure 12.5.
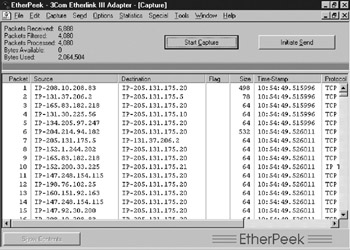
Figure 12.5: Captured Packets Meeting Your Filtering Criteria Are Listed by Time of Occurrence
The packets captured that meet your predefined filtering criteria are listed in the order in which they are observed on the network. As indicated in Figure 12.5, packets are numbered sequentially and their source and destination address, packet size, time of occurrence, and protocol are listed. As we will shortly note, there are several methods you can use to alter information displayed about each captured packet.
12.1.1.4 Display Options
In examining Figure 12.5, note the column labeled "Flag" that appears blank. In actuality, that field can display up to five characters that indicate the occurrence of certain types of predefined situations. Those situations can be observed through the Packet Flags tab in the program's Display Options dialog box, which is illustrated in Figure 12.6. In the Packet Flags tab shown in Figure 12.6, an asterisk (*) is shown and is used to indicate IEEE 802.3 Logical Link Control (LLC) packets, while the alphabetic characters C, F, R, and T are used to indicate CRC checksum errors, frame alignment errors, runt/oversize packet errors, and trigger packets, respectively. When any of these conditions occur, the appropriate character is displayed in the Flag field previously illustrated in Figure 12.6.
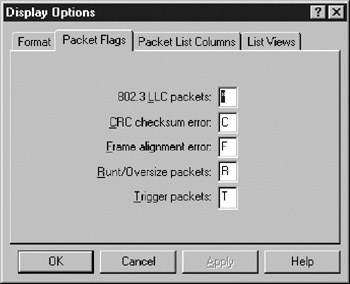
Figure 12.6: Use the Packet Flags Tab in the Display Options Dialog Box to Control the Display Indicator Used to Denote Five Predefined Conditions
Returning briefly to Figure 12.5, note that during the monitoring period, a total of 6888 packets were received. This means that 688 packets flowing on the network were read. However, because a filter was employed, only 4080 packets met the filtering criteria and were processed . Because continuous monitoring was not employed, the approximately 2 Mbytes of buffer space were used until the number of available bytes reached zero and packet capturing terminated .
Another display option you can use to control the display of packet information is the Packet List Columns tab located in the Display Options dialog box. Figure 12.7 provides a view of the default settings of the previously mentioned tab. Note that you can display a variety of other packet fields, such as source and destination port values, which can be extremely important when attempting to ascertain information about the application being transported.
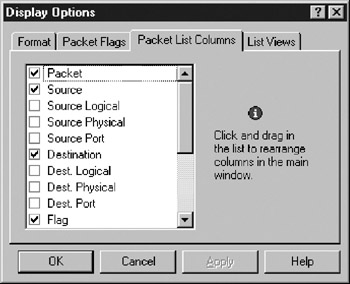
Figure 12.7: Use the Packet List Columns Tab to Control the Display of Packet Information on the Packet Capture Screen
12.1.2 Statistics
Although a major rationale for the use of EtherPeek or a similar packet analysis program is to decode the content of packets for the purpose of this book, our interest is oriented toward obtaining statistical information. This is because the models developed in this book are oriented toward metrics concerned with the flow of data instead of the contents of the data. Thus, we will conclude our examination of EtherPeek with a peek, no pun intended, at its statistics capability. However, prior to doing so, it should be mentioned that a key function of EtherPeek is its packet analysis capability. By double-clicking on a packet entry in the Packet Capture window, you can have the program decode the contents of the packet.
Returning to the topic of this section, through the Statistics menu you can view a variety of program-generated statistics. Figure 12.8 illustrates the Source Node summary screen display that indicates by IP address the percentage of packets transmitted and the total number of packets transmitted during the previous packet capture session. You can also generate a similar set of statistics by destination node, as well as a summary by both source and destination nodes. Through the use of one or more of the previously mentioned displays, you can identify the percentage and number of packets transmitted by specific devices or to specific devices during the packet capture period, thus providing you with the ability to obtain information that can be valuable in developing queuing models.
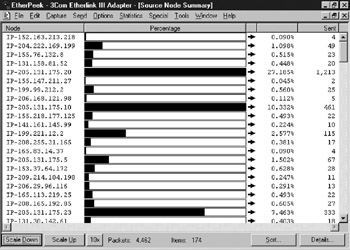
Figure 12.8: Use EtherPeek's Statistics Menu to Display Summary Statistics Based on the IP Address of Packets Transmitted, Packet Destinations, or Both
In concluding this brief examination of EtherPeek, Figure 12.9 illustrates the program's Summary Statistics screen display. Note for each packet capture session the summary statistics display provides a summary of the distribution of packets by packet length as well as other information, such as the duration of the packet capture session, the total number of packets read, packets collected and multicast and broadcast packets. Also note that because the LAN monitored is a heavily utilized network, it only required six seconds to fill a 2-Mbyte packet buffer. Thus, to obtain a longer period of observation, you should more than likely consider employing a more narrowly focused filter as well as using a larger buffer size.
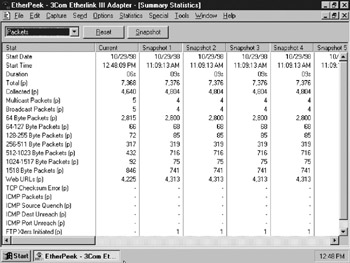
Figure 12.9: EtherPeek Summary Statistics Display Provides a Summary of Packets by Packet Length Interval
[*] For example, if your LAN runs IP and NetWare, you might want to limit statistics gathering to IP because NetWare is not routed to the Internet.
EAN: 2147483647
Pages: 111