Detailed Function and Process Documentation
Detailed Function and Process Documentation None of the techniques described above does more than identify activities, giving each a name and perhaps a number and description. Aside from exploding a process into smaller processes in a data flow diagram, there is no provision in these techniques for documenting in detail how an activity works. This requires a different approach. Many processes are trivial on the surface: "record order", "issue work order", and so forth. The data flow diagram shows the information used and the information produced. A paragraph of text in the accompanying model documentation may be sufficient. Some processes, however, require more documentation in order to describe any algorithms used as well as any business rules that apply. Several techniques originally developed for documenting program logic are available for this. Among them are:
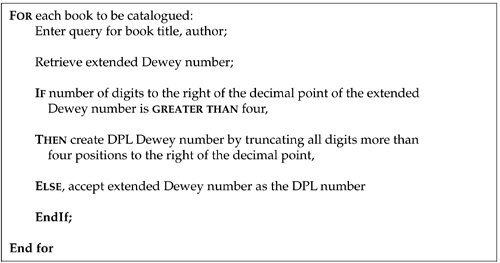
Structured Natural LanguageStructured natural language [7] and pseudo-code are ways of describing specific processes. These typically describe the implementation of business rules, although until recently we didn't realize this. Pseudo-code specifically uses key words derived from programming and is similar in many ways to programming languages such as Pascal or C. Structured natural language takes a similar approach, but it relaxes some programming constraints to make it more readable for the casual user . Structured natural language is a more appropriate part of a requirements analysis. Carma McClure and James Martin described structured English in their 1985 book, Diagramming Techniques for Analysts and Programmers . Figure 4.26 shows an example of structured natural language. Note that there are four basic types of structure in this passage:
Figure 4.26. Structured Natural Language. Carma McClure and James Martin cite a set of rules for constructing structured natural language descriptions: Format
Key Words
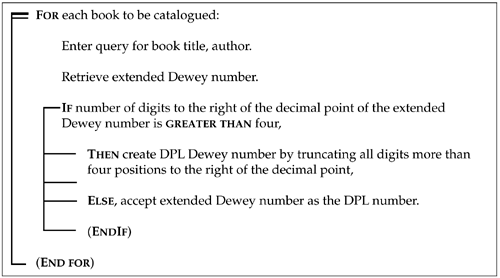
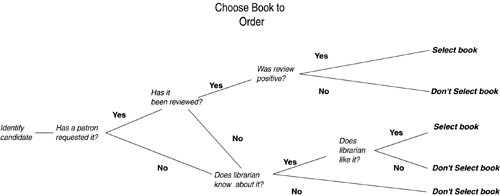
Within these constraints, the wording should be chosen to be as easy as possible for end users to understand. With all due respect to Ms. McClure and Mr. Martin, exception could be taken to Rule 7. In the interest of making the text as comfortable as possible for nontechnical people, the logic key words ("greater than", "less than", etc.) should not be abbreviated. It is arguable whether or not any of the key words should be capitalized. The sentences should certainly be as close as possible to common natural language sentences. Action DiagramsMs. McClure and Mr. Martin also show an action diagram (not to be confused with UML's "activity diagram") as a way of continuing the function-hierarchy idea into the workings of an activity itself [Martin and McClure, 1985, pp. 183209]. The sequences, conditions, cases, and repetitions described above for structured natural language and pseudo-code can be represented as a graphic hierarchy: The statements of actions are listed sequentially with bars to indicate nesting, loops , and branchings of various kinds. Figure 4.27 shows a sample action diagram. Figure 4.27. Action Diagram. In the diagram, a simple bracket surrounds groups of steps to be considered together. The steps to be performed for each response to an IF statement constitute a special case of bracketing such groups of steps. In that case, the bracket is divided between the steps to be performed if the statement is true and those to be performed if it is false. In this case, the bracket points to the IF, ELSE, and ENDIF statements. Similarly, the bracket points to each element of a CASE structure. Loops are represented by a thickened bracket with a doubled line at the top, pointing to the DO or FOR statement. Bracketed groups may be nested inside each other. This provides a hierarchical representation of the steps. Exits are shown by an arrow pointing to the left with the arrowhead outside the level being exited. Decision Trees and Decision TablesLike the flow charts popular in the 1950s and 1960s, UML activity diagrams may include logical tests and branching. Data flow diagrams and IDEF0 diagrams, on the other hand, do not show branching logic. In these cases, for example, after process 1, either process 2 or process 3 may be performed, arrows are drawn to both of them without describing the constraints that cause one or the other path to be taken. Sometimes this can be mitigated by naming a process: "If it is Tuesday, then...." Sometimes the decision logic is much more important, however, and this deserves a model in its own right. This is particularly true when business rules are involved. Sometimes this logic applies within a process, and sometimes it applies to sets of processes. A decision tree is simply a set of lines drawn to show the possible paths that may be taken, depending on various tests of values. The graphic allows you to represent each alternative value for a variable and map what is to be done next . The technique is actually much more powerful for problem solving than will concern us in this book. Howard Raiffa, in his 1968 book, Decision Analysis , describes the technique shown here, as well as kinds of problems in probability theory that the technique can be used to solve. Figure 4.28 shows a sample decision tree, describing the decisions associated with ordering a book. Was it requested ? Has it been reviewed?and so forth. This example shows only "yes/no" decisions. More complex ones are also possible. Figure 4.28. Decision Tree. A variation on the decision tree is a decision table . This is a table representing a sequence of decisions to be taken in a particular evaluation. A set of conditions is shown on the left, with one row for each permutation of values for the decisions. A column on the right shows each resulting decision, based on the particular permutations in that row. An example is shown in Table 4.2. Each of the decision points is a column in the table. Rows are then established for each combination of yes and no answers to the decision point. In some cases, a question is not applicable because of the answer to the previous one. For example, if the librarian does not know about a book, it is meaningless to ask whether the librarian likes it. In such cases the cell is indicated by "". Table 4.2. Decision Table
Other Hierarchical TechniquesOther techniques for documenting program code could be used to document business logic as well. These typically represent a problem as a hierarchical structure. Best known are the "HIPO" (Hierarchical input and output) diagram and the Warnier-Orr diagrams. Each of these can represent either a data structure or a set of activities in hierarchical form. See the 1985 McClure and Martin book for more information. |
| | |
| Team-Fly |
| Top |
EAN: 2147483647
Pages: 129


