Process Four: Describe the Enterprise
Process Four: Describe the Enterprise The enterprise is described by a series of graphic and textual models. Each of the 36 cells in the Architecture Framework contains models of some aspect of the enterprise. In requirements analysis we are concerned only with the second and third rows: We need models that describe the business the way the business owners see it and models that describe it in more architectural terms. This book presents alternative models that lie in those two rows. Not all of them are appropriate for all situations. A primary purpose of this book is to present enough information about the techniques to allow you to make informed choices. Clarence Feldmann, in his 1998 book about the activity modeling technique, IDEF0, described seven basic principles of modeling that drive that technique. Of those, the following apply to all the models described in this book.
Overall, this is a good list of characteristics to help us judge the quality of modeling approaches. In addition to these principles, Mr. Feldmann said that all IDEF0 models must be graphic. Making all models graphical is desirable, of course, but we don't know how to do so for all cells yet. Indeed, many aspects of the typical enterprise that must be captured cannot be represented graphically. Pictures are good for displaying the overall structure of something, but they are very poor for describing details. Text remains a vital part of each deliverable . Mr. Feldmann also said that all IDEF0 models must be hierarchical, but not all models in all cells are that, either. (See Chapter 4 for more information on IDEF0.) Briefly , in terms of the columns of the Architecture Framework, the categories of modeling effort to be done are the following:
The deliverable from this process is a set of models, fully documented. The models are described in detail in the remainder of the book, but it is worthwhile to understand the significance of each as we establish a project plan. The above are described further in the following sections: Step 1: Define Data Models (See Chapter 3)These describe the things of significance to the business and the relationships between them. A data model may be either an entity/relationship model or an object model. In Row Two, this describes the concrete things seen by the people running the business, defined in terms of business jargon, possibly with anomalies. In Row Three, the model captures the underlying structures of the business, of which the things seen by business people may be only examples. The Row Three models must be consistent and coherent . This implies two main tasks that make up this step: Task 1: Create Business Data ModelThe first data model describes the objects seen by the people who carry out the business. This tends to consist of tangible entity types or object classes representing the things people see. Relationships may be multivariate, involving more than two entity types, and they may be "many-to-many". There is no requirement for the models to be "normalized". [4]
This task may be skipped , if it is possible to create the conceptual model directly from interviews or session notes from one or more "joint application development" (JAD) modeling sessions. Realize that doing so, however, will put an additional burden on the subject-matter experts to understand and validate the conceptual model. In some companies this is not a problem, but in others it is. At the very least, when the conceptual model is presented, each generic entity type should be described in terms of the concrete entity types it replaces . Task 2: Create Conceptual Data ModelThe second data model in this phase is the model of the fundamental things the business is concerned with. First, this means that certain modeling constraints are applied. If entity/relationship modeling is used, for example, all relationships are binary and all relationships are "one-to-many", following the rules of normalization. It also means that the entity types themselves may be redefined to be a bit more abstract, so that they represent the more generic things, of which, as stated above, the things viewed by the business are often examples. For example, where the business sees CUSTOMER, VENDOR, AGENT, EMPLOYEE , and so forth, the conceptual model sees simply PARTY or BUSINESS ENTITY , encompassing the two subtypes of PERSON and ORGANIZATION . The other terms ("customer", etc.) are actually descriptions of roles played by people and organizations, to be modeled explicitly. Step 2: Define Activity Models (See Chapter 4)These models describe what the enterprise does . In Row Two, they describe the current physical business processes understood by the people in the company. This will be in terms of the forms, computer systems, and other mechanisms by which people carry out their work. All activities carried out are represented, whether they contribute to the company's objectives or not. Indeed, this may include many activities done in a typical company only to make up for shortcomings in existing systems. In Row Three, the model describes the underlying functions being performed: the content of the data being processed and the activities required to meet the firm's objectives. Mechanisms are not portrayed, nor are activities that don't add value to the company's products and services. Chapter 4 contains more detailed descriptions of each of these techniques. Step Two consists of the following tasks: Task 1: Identify Current Business ProcessesThe process of identifying the activities of a business begins with analysis of the way things are done now. Ideally, you should begin with a global view of the organization as a whole, describing the players or external entity types that feed information to and use information from it. Once the context has been established, examine each process that comprises this global view, carefully documenting each step, the data received by it, and the data produced by it. In fact, it may only be possible to work "bottom up", tracing processes from their triggering events, through the activities performed, to some kind of conclusion. It may be that only after these atomic activities are identified will it be possible to group them into meaningful larger processes. Several techniques are available for doing this. The oldest, the physical data flow diagram , uses one box or circle for each activity, indicating within each the agent performing the activity. Each activity may then be "exploded" to describe its component activities and flows. A context data flow diagram is used at the highest level, with a single box or circle representing the entire company's operation, along with all the external entity types (customers, suppliers, etc.) with which it interacts . More recently, business process diagrams also show processes as boxes (although some tools permit replacement of these with graphic icons). They line up the processes on the diagram, however, so that each agent is shown with its processes in a row. Process diagrams in the UML take a similar approach. As part of this task, in anticipation of Step 5, begin to identify the principal external events that the company must respond to in order to carry out its mission. Task 2: If Appropriate, Create Essential Data Flow DiagramsPhysical data flow diagrams and process models are usually intimately tied to the mechanisms that carry out each activity. To complete the analysis process, it is necessary to separate the underlying functions of an organization from the mechanisms that carry them out. The idea is to create models that are technologically neutral . The physical data flow diagram or the business process model can be converted to what Steven McMenamin and John Palmer call an essential data flow diagram [McMenamin and Palmer, 1984]. This differs from the more physical models in three important ways: First, the activities are described not as physical processes, but in terms of the underlying functions being performed. For example, instead of "Fill out purchase order", you have "Order products". Second, activities that are simply there to accommodate inadequate systems but do not support the goals and objectives of the organization are not included. In other words, the only activities presented are those which add value to the enterprise's efforts, plus those that directly support these functions. Third, an "essential activity" is defined in terms of the external events that affect the enterprise. These might include such things as "Receive order", "Receive job application", "Receive shipment", etc. The activities are grouped according to these events, and then the parent activity of each group (which represents the complete response to an event) is considered an "essential" activity. (Internal events, where one activity triggers another, are not of concern here.) See page 32, as well as Chapter 4, for more information about creating an essential data flow diagram. Task 3: If Appropriate, Create IDEF0 DiagramIDEF0 diagrams are similar to data flow diagrams, except that they merge the elements represented on both physical and essential data flow diagrams. In addition to the data flowing into or out of an activity, an IDEF0 diagram also shows which activities control it, and what mechanisms may be used to perform it. It doesn't show external entities or data stores explicitly, but it does provide a much more sophisticated approach to "exploding" an activity into its component activities. Some companies may prefer to use this technique over the data flow diagram version. Task 4: If Appropriate, Create Function HierarchyA simpler way of representing the underlying functions of an enterprise is the function hierarchy , also called the functional decomposition diagram . This is simply a hierarchical representation of the functions of the enterprise. At the top of the hierarchy is the company's mission, broken into the six, seven, or eight primary functions that contribute to that mission. Each of these is broken out in turn . Even without the procedures associated with creating essential data flow diagrams, the developer of a function hierarchy should identify the underlying functions of the business, without regard for the technology used to carry them out. A proper function hierarchy contains only those functions that are directly concerned with meeting the objectives of the enterprise, not those required to support these functions because of current technology. At the bottom of the hierarchy, one level should be clearly identified as the "essential" level, according to the criteria for essential activities described above. Task 5: Create Function/Data MapOnce the data entity types have been defined and functions have been modeled, it is necessary to relate them to each other. Each function transforms some data into other data. Using the language of the data model, specify the entity types (and attributes) that are used by each function. Then specify the entity types and attributes whose occurrences are created by the function. This can be arranged in matrix form, with the entity types representing the columns and the functions representing the rows. Each intersection represents the relationship between a particular entity type and a particular function. The function may create, retrieve, update, or delete occurrences of the entity type. (People typically call this the " CRUD" matrix " [5] from the first letters of these four actions.)
Among other things, this is a good cross check of the models. If a function has no data associated with it, look carefully to see if it is really a function. Or see what data are missing from the data model. If an entity type does not have at least one function to create occurrences and one to retrieve occurrences, then either you are missing one or more functions, or that entity type doesn't really define anything of significance to the enterprise. Step 3: Define Location Models (See Chapter 6)These describe where the company operates. In Row One this is simply a list the cities where the enterprise operates. At Row Two this is a detailed list of company offices by location, which may or may not be represented graphically on a map. It also includes major communications lines between locations. At Row Three, this is a description of, among other things, where functions are carried out, where data are kept and used, where people work, etc. Indeed, Location, more than any other column, is intimately connected to all the other columns. These models may or may not be in graphic form. Task 1: Describe Location NetworkWhere does the company operate ? What kinds of things are done at each location? How are they related to each other? One location may be headquarters and others may be manufacturing plants. In one pharmaceutical company, its headquarters is in the American Midwest, where research is planned and ultimately the results are processed. But primary research locations are in several European cities as well, and other, smaller, locations are in other cities around the world. Task 2: Define Roles, Data-Distribution RequirementsSpecifically , what tasks are done at each location, what roles are being performed, and what communications must happen between the various offices? Be careful here to distinguish between communications required to carry out the business and communications which take place simply because it is more economical to process data in one place instead of another. There was great confusion in the early 1980s when corporate divisions discovered that they could afford mini-computers to do their local processing and did not have to rely on a central mainframe. The problem was that some data were still required in headquarters, but this requirement hadn't been articulated before. This genuine business requirement tended to get lost in the power struggles to gain control over the computing processes. A great deal of jockeying went on as that was sorted out. Step 4: Define People and Organization Models (See Chapter 5)At Row Two, these are often organization charts, although even there, organization charts are rarely adequate to describe the complexities of human interactions in an enterprise. More creative representations may be required. The advent of knowledge management has made it even more important to deal with the intricacies of the real organization. Row Three models of people and organizations are not very well developed in the industry, so Chapter 5 has reached into the field of cybernetics to find a good model of the nature of organizations. Whether the approach behind that model is followed or not, an important step in the requirements analysis process is to recognize and articulate the operating principles that both now and in the future guide how people work together. Note that only part of the enterprise is involved in any one project. In principle, only the part of the organization that is of concern to the project need be addressed. Task 1: Articulate Organizational PhilosophyIn the last part of the twentieth century, companies' attitudes and approaches to the way they organized themselves changed radically . The military model, based on generals and enlisted men in a rigid hierarchy, isn't adequate to describe the running of modern corporate organizations. This is because people's work now is concerned more with knowledge than with physical labor. People (and the knowledge they hold) have in fact become the most important asset in any company. In the twenty-first century it has become important, to an unprecedented degree, that people feel satisfied with their jobs and that their work is respected. This has required significant changes in the way companies are organized. As part of the definition of requirements for new systems, it is important to articulate a company's approach and attitude toward its people. What philosophical premises are guiding the way the company is organized? Task 2: Create Organization Chart, Including Descriptions of Lateral Communications and RolesBased on this philosophy, what organizational structures are in place, and how successful are they? Who reports to whom? An important part of the requirements analysis project is to identify and articulate the nature of this organization. Task 3: Map Organization to Viable Systems 15Chapter 5 presents a model of what Stafford Beer calls, in his 1979 book, The Heart of Enterprise , "The Viable System". This is the structure that any self-sufficient system (company, government, biological organism, etc.) must have. Mr. Beer's view of an organization is, to say the least, unusual, and it is impossible to summarize it here. Suffice it to say that his model provides insights into the true nature of an organization's operation. With these insights, it is possible then to understand the real roles played by each part of an organization in a new light. Chapter 6 maps these organizational parts to components of Mr. Beer's model. Task 4: Define Information Requirements, by RoleSpecifically, for each role in the organization, what information is required in order to perform that role? Give an answer not only in the concrete terms of an entity/relationship diagram, for example, but also philosophically, in terms of the roles being played in the viable system. Use cases can be used to articulate in detail how each role is played. Step 5: Define Event and Timing Models (See Chapter 7)These models describe the role of time in the enterprise's operations. At Row Two, these are characterized by annual and other periodic planning cycles, as well as descriptions of the business events that cause the company to do what it does: receipt of an order, resignation of an employee, and so on. At Row Three, these are translated into data-oriented events: recording an order, recognizing the resignation , and the like. Events and timing play a role in various kinds of models, as described in detail in Chapter 7. The extent to which this is important will depend on the nature of the systems development effort. Some applications are strongly concerned with timing and events, while others are less so. Task 1: If Appropriate, Create Essential Data Flow DiagramAs described previously (see page 28), Steve McMenamin's and John Palmer's essential data flow diagram is fundamentally connected to the events that determine an enterprise's activities. It is the external events impinging on an enterprise that determine the nature of its activities. For this reason, the technique affects both Columns Two and Five, and it is described in both Chapters 4 and 7. Even if you don't actually create an essential data flow diagram, this thought process can still inform your building of a function hierarchy. Look for the level in the hierarchy where all the functions are responding to the same external event. When you find such a level, the next level up is an essential function. The significance of the essential functions in the function hierarchy is that they and everything above them are inherent in the nature of the company. That set of functions is fundamentally how the company worksand will continue to work regardless of how the technology changes. Below each essential function the component activities represent the particular way the company has chosen to implement that function. That means that these activities can be changed. It may prove useful to perform that essential function in a completely different way from the way it has been performed. This is the secret of business process re-engineering. Task 2: If Appropriate, Create State/Transition DiagramsThe interplay of events and data can also be represented in state/transition diagrams . These diagrams, described in more detail in Chapter 7, represent how an entity type changes state in response to events. A state/transition diagram describes the set of states that a particular entity type (or part of the business, for that matter) can assume. It consists of a set of circles or round-cornered rectangles, each representing one state of the entity type. Arrows then describe the transition from one state to another. Each arrow is labeled with the event that causes the transition. Task 3: If Appropriate, Create Entity Life HistoriesAn alternative to the state/transition diagram that is more closely connected to the entity/relationship diagram is the entity life history . This was originally described in detail by Michael Jackson in his 1983 book, System Development . It was further described in a 1991 paper by John Hall and Ken Robinson, Logical Data Modeling and Process Specification . This diagram, presented in detail in Chapter 7, is specifically organized by entity type. For each entity type, identify the stages an occurrence of it goes through in the course of its life. What causes the creation of an occurrence, its use in various contexts, and its destruction? The diagram looks a bit like a Yourdon structure diagram [Yourdon and Constantine, 1975] and, unlike a state/transition diagram, includes notations to indicate loops and repetitions. Once the structure of events has been defined, it is possible to identify the specific operations that are invoked for each transition. [6]
Step 6: Define Motivation Models (See Chapter 8)The "why" column of the Information Architecture is about what motivates and what constrains the enterprise. The Row One scope project should have given us the mission of the organization and the specific contribution any particular project may make to that mission, as well as to the enterprise's other goals and objectives. At Row Two, Column Two, activity models describe how business strategies and tactics are carried out in an organization. In Column Six we see how those strategies and tactics are derived from the organization's goals and objectives. Business Goals include such things as "become the leading renter of used cars ", while objectives cover such things as "increase market share this year by at least 5%". Moreover, the goals and objectives also result in business policies and business rules. Business policies and rules are derived from the company's goals and objectives. These specify exactly (well, OK, approximately) how the enterprise is going to operate to accomplish the goals and objectives. At Row Three the business rules are translated into constraints on the data and function models, determining when and under what circumstances specified data may or must be updated. The first four tasks shown here concern Row Two, the Business Owners' views. The remaining two tasks are concerned with Row Three. [7]
Task 1: Describe BackgroundThe heart of the motivation model is derived directly from the strategy study described above. The first task is to restate the vision and mission of the company, as revealed in that study. This should largely have been done in Process One, described above, but these statements should be reviewed as part of this task as well. A vision is the ultimate, possibly unattainable, state the enterprise would like to achieve. A vision is often compound, rather than focused toward one particular aspect of the business problem. It is a statement about the future state of the enterprise, without regard to how it is to be achieved. The vision should have been already defined in the strategy study and is usually not addressed during requirements analysis. A mission is a statement of the approach to be taken to achieve the vision. Like vision, a mission indicates a long- term approachone that is focused on achieving the vision. Like vision, mission is broadly stated in terms of the overall functioning of the enterprise. Also like vision, the enterprise's mission should have been defined during the strategy study and is usually not addressed during requirements analysis. It simply provides a context for requirements analysis. Evaluate the vision and mission statements from the strategy study, and elaborate as necessary. Task 2: Define Ends and MeansFrom the vision and mission statements it should be possible to define the ends and means that will be used to achieve the vision and mission. An end is a statement about what the business seeks to accomplish. It does not include any indication of how it will be achieved. Examples include:
Task 3: Articulate Business PoliciesAll objectives, goals, strategy, and tactics are constrained in an organization by elements of guidance . An element of guidance is a declarative statement (or set of such statements) that defines or constrains some aspect of an enterprise. It is intended to assert business structure or to control or influence business behavior. An element of guidance may be either a business policy or a business rule. One kind of element of guidance is a business policy . This is a statement (or set of statements) that describes the desired operating environment of the enterprise. This could include anything from "Always treat the customer with respect and courtesy " to "Ensure that complaints are always resolved quickly". These business policies are the basis for business rules, and they will provide a context for any system development project. Task 4: Define Business Expression of Business RulesA more specific element of guidance is the business rule . From the business owner's point of view, a business rule is a specific constraint upon the operation of the business. It could affect overall operations, as in "All employees must arrive by 8:00 a.m. each morning", or specific handling of a particular situation, as in "A credit order may not be accepted if the prospective customer has exceeded his or her credit limit". It is important to identify the business rules in effect in an enterprise, since these will significantly constrain what a prospective system may do. Task 5: Map Business Rules to Data ModelAll of the above are architecture Row Two issues. They describe the motivation of an enterprise in terms of the business owners' perspectives. To translate these into Row Three architectural terms, it is necessary to understand the data implications of each business rule. In a manufacturing plant business rules are seen to constrain shop floor actions. In an information system, however, they ultimately constrain data. The rule to prohibit creation of an order when the prospective customer's credit rating is bad becomes a constraint on the ability to create order data when examination of credit rating data shows a bad value. For Row Three, the Business Rules Group in 1995 defined four kinds of business rules:
Barbara von Halle, in her 2002 book, Business Rules Applied , called "action assertion" simply "constraint" and asserted that this could be either a mandatory constraint (rigorously enforced) or a guideline . She also asserted that a derivation had to be either a computation (derived from a mathematical formula) or an inference (based on a logical expression). In addition, she recognized action enabler rules , which are assertions that if a condition arises, certain actions must be performed (or may not be performed). The first two categoriesdefinition of terms and factsare actually in the domain of the Column One data model. That is, the data model is about the terms which refer to things of significance, and about the relationships, attribute assignments, and supertype structures which are facts about those things. Data models can also be extended to include representation of derivations, with the documentation of each captured behind the scenes. Action assertions, however, for the most part cannot be represented in the data model [Hay, 1996]. It is the constraints represented by action assertions that are the domain of Column Six. The tools for representing them, alas, remain primitive. Ron Ross has developed a notation for adding business rules to a data model [Ross, 1997], but this is fairly intricate . The modeling technique object role modeling [Halpin, 2001] can also describe many rules directly. (See Chapter 8 for descriptions of the Ross and ORM approaches.) At the very least, action assertions should be described in natural language as part of the documentation that accompanies an entity/relationship model. Even when natural language is used, identifying patterns of business rules can be useful in organizing them [Brenner, et al , 2002]. Note that when we describe the domain of Column One as being facts and definitions, we are characterizing it as a representation of the structure of the organization. These definitions and facts are fundamental truths about the enterprise. The action assertions, on the other hand, are in response to conditions on the business. As such, they may change over time. For this reason, they should not be part of the data model that will form the basis for the underlying architecture of a new system. So, action assertion business rules should be documented (by whatever means) independently of the description of the company's data structure. Indeed, it would be desirable if they could be implemented independently by means of a tool that would make them easy to change. In 2002, such tools are only beginning to be built. Task 6: Map business rules to function modelAs stated above, business rules are fundamentally constraints on data . A particular row may not be created if the rule is violated, regardless of the process that is trying to do it. Still, using the rules specified for each entity type (or group of entity types) and the matrix relating entity types to functions (the "CRUD" matrix, described above [8] ), we can determine which functions or processes will be affected by a business rule. This may well affect the way the function is implemented in a future system.
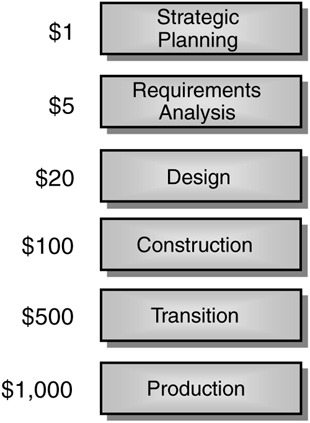
Step 7: Present ModelsIn Process Three, above, one way to get modeling information was with a group of subject matter experts in a "JAD" modeling session. Whether or not this process was followed to get the initial information, a session is at least required to present the final model back to them. The models should be presented not only back to the subject matter experts but also to the company's management, to verify that they are correct and consistent with the organization's strategies. In a modeling feedback session, unlike other kinds of presentations, the job of the person presenting models is to be wrong . However skillful the modeler, there will still be errors and omissions. After all, what is being presented is a series of assertions about the nature of the enterprise. These assertions were created based on conscientious effort, but probably with missing or erroneous information. It is much cheaper to have the modeler be wrong at this stage of the system development life cycle than it would be to use the models as the basis for developing a system and then to discover, as the system was being implemented, that there was a serious misunderstanding about the nature of things. Figure 2.4 shows the relative cost of discovering an error during various stages of the system development life cycle. An error in understanding an application area that cost a dollar to discover during strategic planning could cost a thousand dollars or more to fix if discovered only after a system was implemented. Figure 2.4. The Cost of an Error. The modeling feedback session presents various models for validation. Typically the models are shown via overhead transparencies , so that they can be marked up and corrected as necessary. This means that the subject-matter experts and managers should be encouraged to participate actively. There are two secrets to achieving this: First, the model itself should be as clear and easy to read as possible. In 1998, your author wrote an article on "Making Data Models Readable" for the Auerbach publication, Information Systems Management . In it, he asserted that a data model should be uncluttered, with a minimum of different symbols. The only things that should be obvious on an entity/relationship diagram, for example, are entity types and relationships. Representing other things on the diagram merely clutters it. The entity types should be stretched so that it is not necessary to bend relationship lines. (An " elbow " in a relationship is another symbol on the pagealbeit one with no meaning. This is a distraction.) Functions, for the most part, should be presented in hierarchical form. Data flow and process flow diagrams should be presented only to the people who can verify their specific truths. These diagrams are too detailed for most people. The second secret to getting subject-matter experts involved is in the way the model is presented. First of all, diagrams should be presented piecemeal. Begin the entity/relationship presentation with a slide containing only one entity type. Discuss that entity typeits definition, attributes, and relationships to other things in the business. Add a second entity type and a relationship. Is the relationship correct? Is it really only one? Can it ever be more than one? Must it be one? Little by little, you will have built up the entire model and your audience will have followed every step. Similarly, begin the function hierarchy with the root function. Then add one level. Pick a branch and add another level. Proceed until the entire hierarchy has been presented. Then, if appropriate, go back and discuss any data flows or other dependencies among functions. Third, your presentation style must be one of making assertions about the business in your native language and seeking validation of those assertions. The natural language structure of the relationships used in the Barker approach to data modeling makes this easy: For example, "Each AGREEMENT must be composed of one or more LINE ITEMS , each of which must be for one and only one PRODUCT TYPE." Forget the model. It is only there for taking notes. The important question is, is this sentence true? May an AGREEMENT exist without LINE ITEMS? Can a LINE ITEM be for more than one PRODUCT TYPE? For each entity type, ask for definitions and predicates (which may be either attributes or relationships to other entity types). Step 8: Deliverables: Model DescriptionsThe deliverable from Process Four, then, ultimately is a set of validated and accepted Row Three (and, as necessary, Row Two) models with associated definitions, one for each of the Architecture Columns. These are described briefly above and in detail in the other chapters of this book. The entity/relationship model, the function hierarchy, data flow diagrams, and state/transition diagrams can often be produced by CASE (computer-aided systems engineering) tools. It is equally important, however, to provide, behind the diagrams, extensive documentation as to what each symbol on the diagram means. In the case of entity/relationship models, this means definitions of entity types, attributes, and business rules. In the case of function models, this includes not only a detailed description of the function itself, but also who or what (system) currently carries it out, the events which trigger it, and the result of each. It is also useful to estimate, for each entity type, how many occurrences are expectedboth initially and over the coming five years or so. In addition, estimate how frequently each function occurs in a typical week, month, or year. In addition, it is often useful to provide a text narrative, explaining the model, one step at a time. This is organized around the corrected slides from the modeling feedback session, with the model drawings accompanied by a description of each. In the case of entity type models, this means describing each entity type and relationship in a conversational style. Business-rule descriptions can be included in the narrative as additional information about the entity types, attributes, and relationships constrained. Publish this report as an attractive book. It should be possible for anyone to read it and understand it, even those who cannot read the models themselves. |

| | |
| Team-Fly |
| Top |
EAN: 2147483647
Pages: 129