Commands
Commands
&
The & command, used on the command line, forces the specified process to run in the background.
Example: To start a lengthy program running in the background, use
sort_everything &
|
| As soon as they are successfully invoked, background processes release control of your terminal to the shell that invoked them. This means that you can continue to work without waiting for a lengthy process to finish. |
^Z
The ^Z command stops the current foreground process.
Example: This command works on any process. For example, say you're running a lengthy sort and you want to check what time it is:
| $> biglongsort | # Start lengthy process |
| ^Z | # Suspend with ^Z |
| [3] Stopped (signal) | # Shell acknowledges stop signal ^Z |
| $> date | # Run some other command |
| $> fg 3 | # Restart the process |
bg
job_num
The bg command takes a stopped job and starts it in the background.
Example: Say you started running a find command and it was taking forever. You've got only one window available, so you want to move it to the background without restarting it:
| $ find / -type f -print | grep sammich | |
| ^Z | # Stop current job |
| $ jobs | # Display job list |
| [2]+ Stopped find / -type f -print | grep sammich | |
| $ bg 2 | # Run job in background |
|
| To use this command, you will need to know the job number. Obtain the job number with the jobs command. |
fg
job_num
The fg command moves a running background job to the foreground.
Example: To get the job numbers of your background and stopped jobs, start bigsort running in the foreground:
| $ jobs | # Tell system to display job list |
| [2] Running bigsort | |
| [3] Stopped find / -type f -print | grep sammich | |
| $ fg 2 | # Move bigsort to foreground |
|
| To use this command, you must know the job number. Obtain the job number with the jobs command. |
fuser
[-a|-s] [-n space] [-signal] [-kmuv] name [-][-n space] [-signal] [-kmuv] name
fuser -l
fuser -V
The fuser command is used to display the PID of any process(es) using a specified file. The various types of access are indicated as follows:
| c | File is process' current directory. |
| e | Process is running file as executable. |
| f | File is open for modification. |
| r | File is process' root directory. |
| m | Mmap'ed file or shared library. |
Example: To find and kill all processes running the file /bin/program, use
fuser -k /bin/program
| -a | Show all files listed on the command line, whether accessed or not. |
| -k | Attempt to kill any process accessing the file. |
| -l | List signal names. |
| -m | If the file listed is s mounted filesystem, lists all processes accessing members of that filesystem. |
| -n | Space select a different name space. |
| -s | Silent operation. |
| -signal | Use the specified signal instead of SIGKILL when killing processes. |
| -u | Include the user name of the process' owner in output. |
| -v | Verbose output. Include PID, USER, COMMAND. |
| -V | Output version number. |
| - | Return all options to their default values. |
jobs
The jobs command displays a list of the current background processes.
Example: Say you had two jobs bigsort and a find running in the background. If so, jobs might display the following output:
| $ jobs |
|
| [2] Running | bigsort |
| [3] Stopped | find / -type f -print | grep sammich |
kill
[ -s signal | -p ] [ -a ] pid
kill -l
[ signal ]
Kill a process. More specifically, the kill command sends one of a variety of possible signals to the specified process. The default signal is TERM. The pid parameter is a process id, which may be obtained using the ps command. You need to be superuser to use this command on anyone other than yourself.
Example: To kill process 1234 immediately without giving it a chance to finish what it is doing, use
kill -9 1234
|
| One way to kill processes is by process id number. To get the process id number, run ps aux and grep for the name of the command you're targeting. Another is to kill by job number: |
kill %1
|
| To kill someone else's process, you must be a superuser. The command to use is |
-s signal
Use the specified signal, rather than the default.
| -p | Print the pid of the named process, but do not signal it. |
| -l | Output a list of possible signals. |
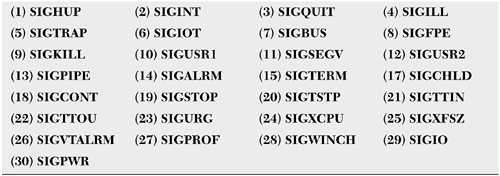
Example: To display the list of all possible signals, use the following (see Figure 3-1 for a tidy, formatted version of the output of the following command):
kill -l
Figure 3-1. Signals
killall
[-eiqvw] [-signal] command_name
killall
-l
killall
-V
killall attempts to kill all processes executing the command specified by command_name. By default, this is accomplished by use of the SIGTERM signal. However, other signals may be specified either by name (see /usr/include/linux/signal.h) or by number.
Example: To kill all processes (not just those owned by you) currently running the mail command, use
killallmail
Example: To kill all processes running the mail command with the strongest possible signal, use
killall -9 mail
| -e | Requires long filenames ( > 15 char) to be matched exactly. |
| -i | Prompts the user for confirmation before killing. |
| -l | Lists possible signals. |
| -q | Runs quietly. Suppress error messages. |
| -v | Runs verbosely. Display a message for each successful termination. |
| -V | Outputs version information. |
| -w | Waits for signaled processes to die. |
nice
[OPTION] [COMMAND [ARG] ]
Start a command with the specified priority rather than the default. By default, commands are run with a priority of zero. To give your command a lower priority (and thereby make it run slower), you may specify a value between 1 and 19. To make it run faster, you may specify a value between -1 and -20. You must be the superuser to specify a negative value.
Example: To start up big_program but force it to yield some of its processor time to other programs, use
nice 19 big_program
Example: To start up big_program, but enable it to snatch some processor time from other, less deserving programs, use
nice -20 big_program
|
| Use renice to modify the priority of a command which is already running. |
|
| To start a process with a higher priority (e.g., a lower priority number), you must be a superuser. |
| -nADJUSTMENT |
|
| -ADJUSTMENT --adjustment=ADJUSTMENT | Use the specified ADJUSTMENT instead of the default. |
nohup
COMMAND [ARG]
Execute the specified command, ignoring the hangup signals (particularly those sent when you logout). The idea is that the command will continue to run after you logout. Also, nohup increases the scheduling priority to 5, which means it will run a bit slower. Output is sent to nohup.out.
Example: To start up big_program telling it to continue to run even after you're at home asleep, use
nohup big_program
pidof
[-s] [-x] [-o omitpid] [-o omitpid..] program [program..]
Locate and print the process id of the specified program.
Example: To learn the process id of the sendmail program, use
pidof sendmail
| -s | Limit output to a single pid. |
| -x | If "program" is a script, also output the pid's of shells running the script. |
| -o omitpid | Ignore processes with the specified pid. |
ps
[-] [lujsvmaxScewhrnu] [txx] [O[+|-]k1[[+|-]k2 ]] [pids] --sortX[+|-]key[,[+|-]key[, ]], --help, --version
ps (Process Status) retrieves and displays information about currently running processes. Depending on the command line options, the output of this command will include various permutations of the following:
| Column | Description |
| %CPU | Rough percentage of CPU time consumed. |
| %MEM | Rough percentage of system memory consumed. |
| COMMAND | Command that started process. |
| NI | Nice value of process. |
| PID | Process ID. |
| PPID | Process Parent ID. |
| RSS | Real memory used. |
| SIZE | Virtual memory consumed by process. |
| STA | Current process state. One of the following: |
| R | Running |
| S | Sleeping |
| D | Uninterruptible sleep |
| T | Stopped or Traced |
| Z | Zombie |
| START | Time process started. |
| TIME | Total CPU time used. |
| TTY | Terminal associated with process. |
| UID | User id of process originator. |
| USER | User name of process originator. |
| WCHAN | Event process is waiting for. |
Example: To display a long list of information about my current processes, use
ps l
FLAGS UID PID PPID PRI NI SIZE RSS WCHAN STA TTY TIME COMMAND
100 0 390 1 0 0 1232 808 wait4 S 1 0:00 -bash
100100 0 391 1 0 0 724 296 read_chan S 2 0:00 /sbin/min
100100 0 392 1 0 0 724 296 read_chan S 3 0:00 /sbin/min
100100 0 393 1 0 0 724 296 read_chan S 4 0:00 /sbin/min
100100 0 394 1 0 0 724 296 read_chan S 5 0:00 /sbin/min
100100 0 395 1 0 0 724 296 read_chan S 6 0:00 /sbin/min
100000 0 420 390 0 0 1200 648 wait4 S 1 0:00 sh /usr/X
100 0 421 420 0 0 1828 656 wait4 S 1 0:00 xinit /us
100100 0 424 421 0 0 2968 1944 do_select S 1 0:01 /usr/X11R
100100 0 433 424 0 0 1496 724 nanosleep S 1 0:00 wmclock -
100100 0 878 424 0 0 2488 1656 do_select S 1 0:00 xterm -sb
100100 0 970 424 0 0 2448 1620 do_select S 1 0:00 xterm -sb
100 0 879 878 0 0 1240 808 wait4 S p1 0:00 bash
100100 0 884 879 0 0 1244 768 do_signal T p1 0:00 vi
100100 0 911 879 0 0 1268 720 do_signal T p1 0:00 top
100100 0 1016 879 0 0 1388 752 do_select S p1 0:00 vi t
100 0 971 970 10 0 1236 796 wait4 S p2 0:00 bash
100000 0 1020 971 11 0 956 492 R p2 0:00 ps l
Example: To display full process information about all processes, use
ps aux
Example: To display full (f option) process information about all processes associated with user jones (u option) to standard output, use
ps fu jones
| l | Long format. |
| u | User format include user name and start time. |
| j | Jobs format pgid sid. |
| s | Signal format. |
| v | Vm format. |
| m | Displays memory information (combine with p flag to get number of pages). |
| f | "Forest" family tree format for command line. |
| a | Show processes of other users, too. |
| x | Show processes without controlling terminal. |
| S | Add child cpu time and page faults. |
| c | Command name from task_struct. |
| e | Show environment after command line and "+". |
| w | Wide output: Don't truncate command lines to fit on one line. |
| h | No header. |
| r | Running processes only. |
| n | Numeric output for USER and WCHAN. |
| txx | Look only at processes with controlling tty xx. |
| O[+|-]k1[,[+|-]k2[,...]] | Order the output by the sequence of sort keys k1, k2, - reverses default order of sort. There are a lot of possible sort keys. |
| Short | Long | Description |
| c | cmd | Simple name of executable. |
| C | cmdline | Full command line. |
| f | flags | Flags as in long format F field. |
| g | pgrp | Process group ID. |
| G | tpgid | Controlling tty process group ID. |
| j | cutime | Cumulative user time. |
| J | cstime | Cumulative system time. |
| k | utime | User time. |
| K | stime | System time. |
| m | min_flt | Number of minor page faults. |
| M | maj_flt | Number of major page faults. |
| n | cmin_flt | Cumulative minor page faults. |
| N | cmaj_flt | Cumulative major page faults. |
| o | session | Session ID. |
| p | pid | Process ID. |
| P | ppid | Parent process ID. |
| r | rss | Resident set size. |
| R | resident | Resident pages. |
| s | size | Memory size in kilobytes. |
| S | share | Amount of shared pages. |
| t | tty | The minor device number of tty. |
| T | start_time | Time process was started. |
| U | uid | User ID number. |
| u | user | User name. |
| v | vsize | Total VM size in bytes. |
| Sort order |
|
| -Ou , --sort:user | -Oc , --sort:cmd |
| -OU , --sort:uid | -Op , --sort:pid |
| -OP , --sort:ppid | -Og , --sort:pgrp |
| -Oo , --sort:session | -Ot , --sort:tty |
| -OG , --sort:tpgid | -Ok , --sort:utime |
| -OK , --sort:stime | -Oj , --sort:cutime |
| -OJ , --sort:cstime | -Oy , --sort:priority |
| -OT , --sort:start_time | -Of , --sort:flags |
| -Om , --sort:min_flt | -On , --sort:cmin_flt |
| -OM , --sort:maj_flt | -ON , --sort:cmaj_flt |
| -Ov , --sort:vsize | -Or , --sort:rss |
| -OC , --sort:pcpu | -Os , --sort:size |
| -OR , --sort:resident | -OS , --sort:share |
| xpids | Restrict output to only the listed processes. |
| --help | Output a help message. |
| --version | Display version information. |
pstree
[-a] [-c] [-h] [-l] [-n] [-p] [-u] [-G|-U] [pid|user]
pstree
-V
Output the family tree of running processes. If no process id or user name is specified, the tree is rooted at init. Identical branches are merged in the display by prefixing the process name with a count.
Example: Say your xinit process has a PID of 430. To display it and all its descendants in tree form with their PIDs, use
pstree 430 -p
xinit(431)-+-X(432)
`-wmaker(434)-+-wmclock(443)
|-xterm(637)---bash(638)
|-xterm(715)---bash(716)---pstree(2118)
|-xterm(718)---bash(719)---top(720)
|-xterm(721)---bash(722)---vi(2051)
`-xterm(724)---bash(725)
| -a | Include command line arguments in the display. |
| -c | Do not compact the identical subtrees. |
| -G | Graphical display. (Use vt100 line drawing characters.) Very cool. |
| -h | Highlight family tree of current process. |
| -l | Do not truncate long lines. |
| -n | Numeric sort by PID. |
| -p | Include PIDs in display. |
| -u | Include uid transitions in display. |
| -U | Graphical display. Uses UTF-8 (Unicode) graphical characters in display. |
| -V | Display version information. |
renice
priority [[-p] pid ] [[-g] pgrp ] [[-u] user ]
renice enables you to alter the scheduling priority of running process(es). The default priority is 0. To make a process run faster, specify a negative priority value (you must be a superuser to do this). To give a process a lower priority (and thereby make it run slower), specify a positive priority. The priority value must be in the range -20 <= priority <= 19.
Example: To play a funny joke on your buddy, "Tim," and make all his stuff run really slowly, use
renice 20 -u tim
You must be a superuser to be this funny.
|
| To give a running process a higher priority (by decreasing its priority number) you must be a superuser. |
| -g | Include processes belonging to the specified group in any modifications. |
| -u | Include processes belonging to the specified user in any modifications. |
| -p | Include the specified process in any modifications. |
top
[-] [d delay] [q] [c] [S] [s] [i]
Top displays a listing of the processes utilizing the CPU. Output may be ordered by CPU usage, memory usage or runtime. Note that top is itself a CPU-intensive task, so use it sparingly. To change options while top is running, use the s command at the prompt and specify the new options.
Example: In my experience, top is generally run without arguments.
top
It produces output such as the following:
8:59am up 3 days, 16:42, 3 users, load average: 0.00, 0.00, 0.00
39 processes: 38 sleeping, 1 running, 0 zombie, 0 stopped
CPU states: 0.9% user, 0.0% system, 0.0% nice, 99.1% idle
Mem: 95460K av, 87380K used, 8080K free, 17648K shrd, 33748K buff
Swap: 104384K av, 0K used, 104384K free 37184K cached
PID USER PRI NI SIZE RSS SHARE STAT LIB %CPU %MEM TIME COMMAND
6543 root 19 0 716 716 556 R 0 0.9 0.7 0:00 top
1 root 0 0 388 388 328 S 0 0.0 0.4 0:03 init
2 root 0 0 0 0 0 SW 0 0.0 0.0 0:00 kflushd
3 root -12 -12 0 0 0 SW< 0 0.0 0.0 0:00 kswapd
4 root 0 0 0 0 0 SW 0 0.0 0.0 0:00 md_thread
5 root 0 0 0 0 0 SW 0 0.0 0.0 0:00 md_thread
402 news 19 0 708 708 576 S 0 0.0 0.7 0:00 innwatch
1287 root 0 0 796 796 656 S 0 0.0 0.8 0:00 bash
395 root 0 0 296 296 248 S 0 0.0 0.3 0:00 mingetty
36 root 0 0 364 364 312 S 0 0.0 0.3 0:00 kerneld
210 bin 0 0 332 332 264 S 0 0.0 0.3 0:00 portmap
224 root 0 0 472 472 396 S 0 0.0 0.4 0:00 syslogd
233 root 0 0 536 536 324 S 0 0.0 0.5 0:00 klogd
244 daemon 0 0 404 404 328 S 0 0.0 0.4 0:00 atd
255 root 0 0 472 472 392 S 0 0.0 0.4 0:00 crond
267 root 0 0 396 396 328 S 0 0.0 0.4 0:00 inetd
278 root 0 0 1168 1168 580 S 0 0.0 1.2 0:00 named
| -d | Use the specified delay (in seconds) between updates. |
| -q | Refresh constantly with no delay. |
| -S | Include in usage calculations the usage of the process' children. |
| -s | Run in secure mode. |
| -i | Tells top to ignore idle or zombie processes. |
| -c | Include the process' entire command line in the output. |
Summary of Display Values
| Uptime | How long the system has been running, plus the average number of processes ready to run in the last 1, 5, and 15 minutes. |
| Processes | Count of the number of processes running at the last update. |
| CPU states | Percentage of CPU time in user mode, system mode, niced tasks and idle. |
| Mem | Memory statistics (total K, free K, used K, shared K, buffer K). |
| Swap | Swap statistics (total K, available K, used K, cached). |
| PID | PID of the process. |
| PPID | PID of the process' parent. |
| UID | UID of the process' owner. |
| USER | User name of the process' owner. |
| PRI | Priority of the task. |
| NI | Nice value of the task. |
| SIZE | Size of code + data + stack space, in kilobytes. |
| TSIZE | Code size of the task. |
| DSIZE | Size of data + stack space. |
| TRS | Text Resident Size. |
| SWAP | Size of part of task currently swapped out. |
| D | Size of dirty memory pages. |
| LIB | Size of library pages. |
| RSS | Total amount of physical memory used by the task. |
| SHARE | Amount of shared memory used by the task. |
| STAT | State of the task (Z=zombie, S=sleeping, T=stopped). |
| WCHAN | Show the address or name of the kernel function task is sleeping in. |
| TIME | Total CPU time used by task since invoked. |
| %CPU | Percentage of CPU time used by task since last update. |
| %MEM | Percentage of physical memory used by task. |
| COMMAND | Name of command which started task. |
Once invoked, top may be used interactively. The following are supported:
| <space> | Update display information immediately. |
| ^L | Repaint the screen. |
| h, ? | Display help information. |
| k | Kill a process: Top will prompt for pid. |
| i | Ignore zombie processes and idle processes. |
| n, # | Show the specified number of processes. |
| q | Quit. |
| r | Renice a process. |
| S | Toggle cumulative mode on/off. |
| s | Specify new delay (in seconds) between updates. |
| f, F | Add specified fields to display. |
| o, O | Change order of displayed fields. |
| l | Toggle display of load average and uptime information. |
| m | Toggle display of memory information. |
| t | Toggle display of CPU state and process information. |
| c | Toggle display between command name/full command line. |
| M | Order display by memory usage. |
| P | Order display by CPU usage. |
| T | Order display by time/cumulative time. |
| W | Write current setup to ~/.toprc. |
EAN: 2147483647
Pages: 174