Tuning the JVM
| The Java Virtual Machine, or JVM, on which WebLogic server runs is the single most important software component of your system. Because all aspects of your application rely on the JVM, it is the single easiest place to ruin the performance of your server. Fortunately, it is not terribly difficult to properly configure your JVM. There are several primary areas of improvement:
Server Performance PacksDepending on the platform that your WebLogic server is running on, a performance pack may be available for your system. The value of a performance pack is that input/output operations are configured to better utilize your server resources. To enable performance packs and thereby utilize the resources of your server more efficiently :
As I said, performance packs are not available for all server platforms. If you are not running WebLogic on one of the lucky few, WebLogic will allocate additional threads for use as socket readers, thereby offsetting the performance drain somewhat. Heap ConfigurationWhen it is invoked, the Java Virtual Machine is allocated a certain amount of memory that it organizes into a data structure called a heap. This data structure is used by the JVM to store and access all objects utilized by running processes. There are four command-line variables you can set to affect the life cycle of the heap and thereby tune performance. Set these values within the script you use to start WebLogic. Values should be multiples of 1024 and may be specified in increments of k (kilobytes), m (megabytes), and g (gigabytes).
Note: The-Xms and-Xmx values should be the same size. For HotSpot Java 1.3 and above, it is also possible to tell the JVM a little bit about how the heap should look after a round of garbage collection.
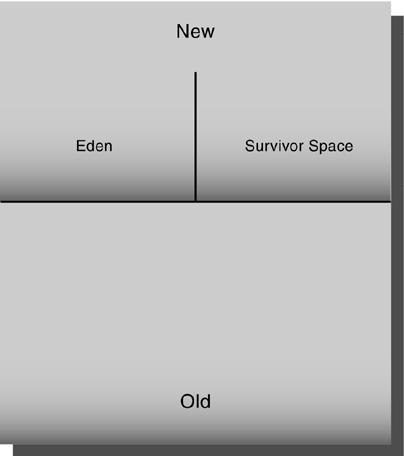
Generally speaking, your JVM should take up about 75% of the available RAM on your system, after the needs of the operating system are met. Beyond that, the ideal size of your heap is determined to a large extent by the garbage-collection process on your system. Garbage CollectionWhen an object is no longer accessible from any pointer in the running program, it is considered to be garbage. In order to keep garbage objects from gradually devouring all of the available memory, Java will systematically comb through the heap and de-allocate space associated with garbage objects. This process is known as garbage collection. There are two types of garbage collection, "generational" and "naive." Naive garbage collection is the less efficient of the two. It examines every object in the heap to determine which are not referenced. Generational garbage collection takes into account the life cycle of the object to speed the collection process. As shown in Figure 10-1, generational heaps are divided into New and Old areas. Figure 10-1. Generational Heaps The new area is divided into the colorfully named "Eden" and "Survivor Space" areas. When new objects are examined and found to be in use, they are copied into the Survivor Space area. When memory use is painfully high (as indicated by the Memory Usage graph under the Monitoring tab), you can force garbage collection. This should be done with caution, however, as garbage collection is an expensive process in terms of CPU time. In order to conclusively discriminate between those objects which are never referenced and those which are, it can be necessary to examine every object in the heap. In order to get the best performance out of your server, you will need to examine the garbage-collection process for each distinct configuration in your domain. Different applications will generate garbage in different ways. One tool for doing this is the verbosegc option:
Once verbose garbage collection is enabled, examine your logs. Look for the following:
|
EAN: 2147483647
Pages: 134
