Chapter 7: Stress Testing and Monitoring ASP.NET Applications
Performance testing is an important component of testing any Web application. In this chapter, we discuss the concepts behind performance testing and its role in the development and testing cycles. We cover performance testing fundamentals and general methodologies for testing a Web application. We also describe the features of the Microsoft Application Center Test (ACT) tool and provide a step-by-step tutorial on how to utilize the tool on an ASP.NET application.
Understanding Performance Testing Concepts
Performance testing is the process of measuring and understanding how the application responds under different user loads. Determining how your ASP.NET application performs under different user loads is an important process to creating a mission-critical application. Besides getting a qualitative analysis of the application's performance, it is also important to get quantitative measurements. The measurements will help you analyze problems and even determine how to fix them properly.
During the performance testing process, it is important to monitor the application for certain errors or performance issues that may occur only under user loads. This helps to identify subtle bugs within the application that you might not otherwise catch until you deploy the application. Monitoring also helps to identify the effects of application changes during the process.
An important step in the performance testing process is identifying the targeted user load. Also, you must account for the load variance in the testing. Most applications do not have a constant load. For example, an expense reimbursement application may experience heavier load at the end of the month when the expense reports are due. In these cases, the performance test must simulate the peak user load rather than the average user load.
Performance tuning is the process of modifying the application to improve its performance and is a natural extension of performance testing. You can modify application design and logic to improve performance. You can adjust system settings, as well as the hardware. During the tuning process, make sure you change only one parameter or piece of logic at a time. Maintain a consistent user load when adjusting system parameters or application logic. Collect and compare the performance results for each test under each setting. Repeat the process until you improve the performance of the application to the desired level.
Using Performance Metrics
When you can measure what you are speaking about, and express it in numbers, you know something about it; but when you cannot measure it, when you cannot express it in numbers , your knowledge is of a meager and unsatisfactory kind: it may be the beginning of knowledge, but you have scarcely in your thoughts advanced to the state of science.
”Lord Kelvin (William Thomson)
You can measure the performance of an ASP.NET application by its latency, throughput, and utilization metrics. All performance metrics (measures of performance) are based on system behavior over time.
Latency
Latency , or response time, measures the delay between initiating or requesting some action and the arrival of the result. You measure latency in units of (elapsed) time. The definition of a specific latency metric must specify both a start and stop event: when to begin measuring the delay and when to stop. Some examples of latency metrics include the following:
-
The time between sending a page request from a Web browser and the time the requested page is completely displayed
-
The time a network router holds a packet before forwarding it
-
The delay between receiving an order for an item at an online store and updating the inventory amount that is reported to other customers
In ASP.NET applications, latency is the delay between the start and end of an operation (or between the request and the response). An application that exhibits a lower latency is always desired. In many Web performance tools, latency is represented by the metric Time to Last Byte (TTLB), which measures the delay between sending out a page request and receiving the last byte of the page response. Another important metric is the Time to First Byte (TTFB), which measures the delay between sending a page request and receiving the first byte of the response. Both the size of the page response and the network latency affect TTFB.
In most applications, latency is linearly proportional to the user load within a range of user loads. In this range, as the user load increases , the latency will proportionally increase. This occurs when the application is in a steady-state , where performance techniques such as connection pooling and caching are in full swing with a set of multiple users. When the application is running with a small user load (one to five users), you do not exercise the same performance-improving techniques, thereby actually increasing the latency at these low user loads.
Figure 7-1 shows a representative graph of an application's latency behavior vs. user load. As shown, latency has a tendency to increase slowly at low levels of user load, but at a certain user load level, latency will increase exponentially. Note the graph begins at a user load where the application has already reached a steady-state.
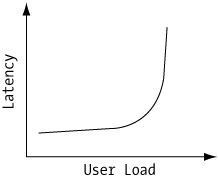
Figure 7-1: General characteristics of latency vs. user load
Typically, the sudden increase in latency is an indication of the system meeting a performance limit on one of its resources. Web servers commonly encounter this scenario when the number of requests exceeds the maximum number of concurrent sessions available. When this maximum is met, any additional requests will be placed in a queue and handled as sessions become available. The time spent in the queue contributes to the increase in latency.
You can divide the latency factors in an ASP.NET application into two categories: network latencies and application latencies. Network latencies refer to the time it takes data to transfer between servers. Application latencies refer to the time the server takes to process the data. An ASP.NET application typically has several different instances of both latency types. Figure 7-2 shows the various latencies in the processing of a Web request.
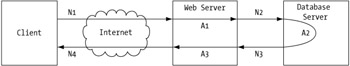
Figure 7-2: Latencies affecting a typical Web application
The latencies in Figure 7-2 represent the following:
-
N1, N4: Network latencies from the client browser to the Web server across the Internet
-
N2, N3: Network latencies within the production environment between the Web servers, application servers (if applicable ), and database servers
-
A1, A2, A3: Application latencies inherent in the server applications
You figure out the total latency of the Web application with the following:
Total Latency = & pound ; N n + A n
where N n = n th Network Latency and A n = n th Application Latency
Network latencies across the Internet are a fact of life for Web applications. Client access can vary from high-speed T1 to intermediate Digital Subscriber Line (DSL) to traditional dial-up access. An option to minimize these latencies is to host the Web servers within major Internet hosting providers that have redundant high-speed connections to major public and private Internet exchange points. This will minimize the number of network hops within the Internet "cloud."
Network latencies within the production environment can be another issue. These latencies can be affected by the physical network layout as well as by network equipment and configuration. Whenever possible, you should configure servers on the same subnet for optimal performance. Also, you should configure servers with fixed IP addresses to prevent a down or unavailable DHCP server from disabling the servers. When equipment performance becomes a factor in the overall latency of an application, consider upgrading to higher performing network equipment (routers, switches, and so on).
Application latencies are another matter entirely. Many factors affect the processing time an application requires to complete a task. To minimize these factors and lower the application latency, keep in mind the following when developing the application:
-
Application design: Minimize tasks that produce high latency such as making roundtrips between servers and using a transaction when none is required. Keep page response sizes down.
-
Code efficiency: Implement code efficiently . Cache data that is used frequently or is expensive to calculate. For quicker content loads, implement both client-side and server-side caching.
-
Database efficiency: Perform database optimization and tuning. Optimize stored procedures and implement indexes to improve database performance.
-
Server hardware: Verify that the hardware meets the system requirements and expected user load of the application.
Throughput
Throughput , or capacity, measures the amount of work done per unit time, or the rate at which responses arrive . Throughput is the rate at which requests can be serviced. You measure throughput metrics in units of inverse time. Some examples of throughput are as follows :
-
Transactions completed per minute
-
Gigabytes of data written to tape per hour
-
Memory accesses per second
-
Megabits of data transmitted per second
In ASP.NET applications, throughput is the number of GET or POST requests per second, or simply the requests per second (RPS). Throughput is one of the more useful metrics, playing an important role in helping to identify performance bottlenecks. Figure 7-3 illustrates the typical characteristic of throughput vs. user load.
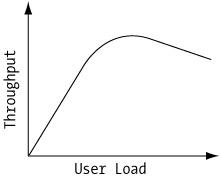
Figure 7-3: General characteristics of throughput vs. user load
Throughput tends to increase at a linear rate as the user load increases. However, at a certain user load, the maximum throughput for the system will be reached, as defined by the peak throughput in Figure 7-3. Additional users on the system will decrease the number of requests serviced, resulting in a decreased throughput. An application must support the maximum number of users serviced while still providing adequate performance to meet the business requirements.
Throughput metrics are highly dependent on the complexities of an application. A highly dynamic Web application would have different throughput metrics than a Web application serving static Hypertext Markup Language (HTML) pages. As such, comparing throughput metrics between different Web applications does not provide much information. However, comparing throughput metrics for the same application will provide valuable information about how changes in the application have affected its performance.
Utilization
Resource utilization , or simply utilization , is a measure of the percentage of available resources (system components , such as the CPU, memory, or data link) consumed by the application. Utilization is a percentile between 0 and 100 percent. When a system component reaches 100-percent utilization, it can no longer perform any additional tasks and will therefore become the performance bottleneck for the system. As a practical matter, latency increases rapidly as utilization approaches 100 percent so that many systems are designed to keep utilization below some threshold such as 70 percent or 80 percent.
Utilization increases proportionally to user load. At a certain limit, the maximum utilization will be reached, and it will stay at this limit as the user load increases. Figure 7-4 illustrates the typical utilization characteristic for a system vs. user load.
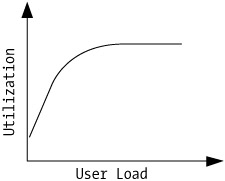
Figure 7-4: General characteristics of utilization vs. user load
If a system component's utilization becomes the performance bottleneck, then an option to improving performance is to upgrade the system component to a higher capacity. You can upgrade most hardware components to a higher capacity. Another option is to distribute the utilization across additional servers using network load balancing. These options, known as vertical and horizontal scaling, are discussed in more detail in the "Exploring Common Performance Testing Approaches" section. Apart from hardware, you need to analyze the aspects of the application (storing session information, data access, caching techniques) discussed in the earlier chapters that may decrease the high utilization.
Performance Metrics Relationships
Monitoring only one of the described metrics does not tell the whole performance story for an application. You must monitor and analyze all three metrics ”latency, throughput, and utilization ”to truly understand an application's performance. In the previous sections, we generalized their characteristics vs. user load. However, the relationships between the metrics provide valuable information about an application's performance.
Take the relationship between latency and utilization. Latency tends to increase as the inverse of unutilized capacity. When a system component reaches a maximum utilization, it will cause a dramatic increase in latency. Because utilization is a metric of each component, gathering test information can be a painstaking task. A major system component such as the CPU or memory may not reach its maximum utilization before the latency becomes unacceptable, as shown in Figure 7-5.
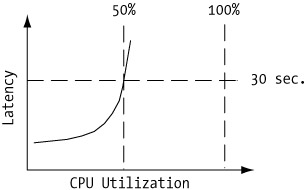
Figure 7-5: Latency vs. utilization for a sample application
In this example, the latency has reached a level of 30 seconds while the CPU utilization has only reached 50 percent. In cases like this, comparing other system component utilizations to the latency metric will help determine which component is the performance bottleneck.
Throughput and latency are different approaches to thinking about the same problem. In general, an application that exhibits high latency will have low throughput (if the delay in fulfilling a request is high, then the number of requests the application can handle will be low). The same criteria used to reduce latency in an application will also increase the throughput. Just as utilization must be analyzed and related to latency, analyzing throughput without consideration for latency is misleading. Latency often rises under load before throughput peaks. Like the sample regarding latency and utilization, the peak throughput may occur at a latency that is unacceptable from an application usability stand-point.
Exploring Common Performance Testing Approaches
You use different performance tests to gather the various performance metrics. The three most common performance tests are as follows:
-
Load/stress
-
Scalability
-
Transaction Cost Analysis (TCA)
The load , or stress, test is the most common performance test because it is the most versatile. The load test allows you to measure the latency, throughput, and resource utilization at varying user loads. The goal of load testing is not only to gather metrics to describe the performance characteristics of the application but also to determine the limit of its performance. In essence, the goal is to crash the application by increasing the user load past performance degradation until the application begins to fail because of resource utilization or the occurrence of errors. Analyzing the results of the stress test will help to uncover bugs that would otherwise go undetected until the application was deployed. Because performance bugs are typically the result of design flaws, stress testing should begin early in the development phase on each area of the application.
Scalability testing is a series of stress tests with different hardware configurations. The goal of scalability testing is to determine the best scaling strategy to support an increased user load. The scalability options are vertical scalability or horizontal scalability.
Vertical scalability , or scaling up, refers to increasing the component capacity of a system onto a bigger and/or faster system. Typical vertical scaling options include increasing the number of CPUs on the server or adding more memory to the server. To test for vertical scalability, run stress tests with a different number of CPUs. An application is termed vertically scalable if its performance increases linearly in relation to the component capacity of the server ”in our sample case, the number of CPUs. A useful feature of the Windows operating system is the ability to specify the number of CPUs to run in the boot.ini file. To enable multiple processors, set the NUMPROC parameter in the [operating systems] section to the number of processors to use:
[operating systems] /NUMPROC=2
Horizontal scalability , or scaling out, refers to increasing the number of servers available to help run the application. A typical horizontal scaling option is to increase the number of load-balanced servers in a Web farm. To test for horizontal scalability, set up a server cluster using Windows 2000 Network Load Balancing or a hardware load balancer. Then run the same stress test with a different number of servers active in the cluster. Finally, analyze the results of all the tests. The results will show whether the application will scale linearly with additional servers.
Transaction Cost Analysis (TCA) is not exactly a type of test but is more a method to formulate the relationship between throughput and utilization. TCA calculates a resource cost to a transaction. To use TCA, you gather test performance metrics for a specific transaction. The transaction can be a unique feature, such as keyword search, or a specific task within the application, such as adding an item to the shopping cart. Using the test metrics, it is possible to calculate the unit cost of a resource per unit of throughput for a particular transaction. TCA is commonly used for capacity planning. For example, if you calculate that the CPU TCA for a keyword search was 20MHz per requests per second, then you could plan to require at lease a 500MHz CPU if you wanted to handle 25 simultaneous requests per second.
Best Practices for Performance Testing
The fundamental goal of performance testing is not only to identify the limitations within the application but also to resolve and push the application beyond these limitations. The performance metrics gathered allow you to determine which changes to make and quantify how well those changes advance toward that goal. The process of performance testing is in many ways more an art form than a science. One checklist will not apply to every application. However, there are some best practices that will help you get started.
The first step is to design the performance test to gather the correct metrics. An ASP.NET application has some general counters and measurements that should always be part of the performance metrics gathered during a test (see Table 7-1). You can find the Web application counters in the Microsoft Application Center Test (ACT) tool, not within any defined objects in Performance Monitor.
| OBJECT | PERFORMANCE COUNTER | DESCRIPTION |
|---|---|---|
| Processor | %Processor Time/_Total Instance | Processor utilization. |
| Memory | Available Bytes | Amount of memory on the server. |
| Network Interface | Bytes Total/Sec | Network traffic from the client to the server. |
| Active Server Pages | Requests Queued | Number of requests queued. |
| Web Application | Avg. Requests/sec | Average number of requests per second. This value is an average over the duration of the test. |
| Web Application | Avg. Time to First Byte (TTFB) | Average time between sending the request and receiving the first byte of the response. |
| Web Application | Avg. Time to Last Byte (TTLB) | Average time between sending the request and receiving the last byte of the response. |
| Web Application | HTTP Errors | Sum of all responses with HTTP result codes in the 400 “499 and 500 “599 ranges. |
It is a good practice to gather baseline performance metrics by running control (performance) tests. You can then compare subsequent tests to the baseline to determine any improvements or to identify changes that have no effect or an adverse effect on performance.
You must design performance tests to be reproducible. A test is valid only if it can be reproduced. If it is not reproducible, you would not be able to correlate performance test results to application changes. When solving performance issues, make changes in a controlled manner, such that subsequent tests are a result of the changes only and not because other factors that invalidate the test. Resist the urge to make many changes at once; instead, make one change at a time.
Performance Tuning
To tune an application for performance, run an initial test against the application and save a base performance metric. Analyze the initial performance to determine if any modifications are needed to resolve any bottleneck issues. After you make the changes, repeat the test and save a second performance metric. Comparing the two metrics will help determine if the changes have improved the application's performance. The cycle continues with application changes and performance retests until the performance requirements are met. This cycle is known as performance tuning .
EAN: 2147483647
Pages: 91