Animating a Chart


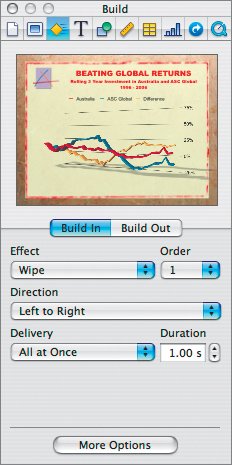
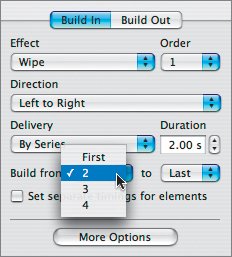
Now that the chart is built, we can animate it. This will allow you to reveal the slide data one series at a time. This can be useful to keep your audience's attention as well as to control the flow of information.

1.

Select the chart on slide 2. Then select the Build Inspector.

2.

From the Effect menu, choose Wipe.

3.

From the Direction menu, choose Left to Right.

4.

From the Delivery pop-up menu, choose By Series.

This option will animate each element in the chart, first the gridlines and then each data series.

5.

Set the duration to 2.00 seconds.

Watch the animation preview in the inspector. Notice how the background and grid wipes onto the screen first. Generally, you'll want this part of the chart already on the page so you'll remove it from the animation.

6.

Choose 2 from the Build from menu; leave the Build to menu set to Last.

Now that the chart is animated, you can choose a transition to move from this page in the presentation to the next.

7.

Select the Slide Inspector and click Transition. Then choose the following options:

  • Transition Effect: 3D Effects: Page Flip

  • Direction: Left

  • Duration: 2.00 s

8.

Press Command-S to save your document.


Apple Training Series. iWork '06 with iLife '06
Apple Training Series: iWork 06 with iLife 06
ISBN: 0321442253
EAN: 2147483647
Year: 2004
Pages: 171

flylib.com © 2008-2017.
If you may any questions please contact us: flylib@qtcs.net