| We will use the data warehouse as the source for a new Analysis Services database that the users can query to support their business initiatives. The database will include dimensions that are structured to make it easy to do different kinds of analyses and will include measures that are based on the relational fact tables as well as more complex calculations. Business Requirements The high-level requirements to support the business objectives are as follows: Profitability analysis. The primary requirement here is query performance and flexibility. Profitability analyses generally need to look at huge amounts of information, and using relational reporting in this area has not worked well because of the time taken to run reports against detail-level data. Users need a solution that enables them to easily access the information to identify opportunities and problem areas. In addition, the system needs to provide very fast (subsecond, if possible) response times so that users are free to explore the data. On-time shipments analysis. An "on-time" shipment is defined as a shipment that was shipped on or before the due date that was promised to the customer. Users need to be able to see the ontime deliveries as a percentage of the total deliveries and to track how this changes over time as they introduce new techniques to improve performance. They also need to understand aspects, such as how many days late shipments are, as well as potentially interesting factors such as how much notice the customer gave and how long from the order date it actually took to ship the products. They need to be able to change the product and customer mix they are looking at and generally to be able to understand what kinds of shipments are late.
High-Level Architecture We will build an Analysis Services database on top of the data warehouse and add a cube and dimensions to support the business requirements. The data will be loaded into the Analysis Services database on a regular basis after the data warehouse load has completed. Our approach will ensure that only the most recent data needs to be loaded into the cube, to avoid having to reload all the fact data every time new data is available. From an architectural point of view, the relational data warehouse is supplying the data storage and integrity, and the Integration Services packages are providing the data consolidation and cleansing. The Analysis Services database will extend the picture shown in Figure 5-1, providing the rich analytics and sheer performance that is required. Because we have defined views in the data warehouse for all facts and dimensions, the Analysis Services database can use these views as its source rather than accessing the physical data warehouse schema directly. Figure 5-1. High-level architecture 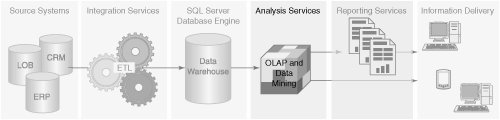
The users will connect to the Analysis Services cube using client tools such as Excel, which provides a drag-and-drop metaphor for easily accessing the information. Also, reporting tools such as Reporting Services can access the information in the cube, making it easier to publish the information to end users. Although many people think of OLAP technology or cubes as restricted to being used for drilling down and pivoting through data, Analysis Services 2005 databases will generally remove the need for reporting directly from the relational data warehouse database. The reason for this is that Analysis Services uses an "attribute-based" model, meaning that all the columns in the underlying data source can be made available for analysis if required, instead of having to go back to the relational data for detail data. Although you can use Analysis Services databases to add analytics to most data structures, the best solution to some calculation issues is to modify the underlying database. We make some changes to the fact views in the data warehouse to present information to Analysis Services in the way we need it for this solution. Alternative Solution: Analysis Services Database over Source Systems Analysis Services databases can be used to create a Unified Dimensional Model (UDM) directly on top of the source systems (the two enterprise resource processing [ERP] systems and some spreadsheets in this example). Because we can get many of the benefits of a complete BI solution using a UDM, including combining information from multiple systems in an easy-to-use and well-performing format, this could potentially save us all the effort required to build a data warehouse and associated extraction, transformation, and loading (ETL) process. This sounds like a great idea! The reality is that although the UDM is a convenient and flexible solution when you need to build a departmental BI solution and don't have the time to do it right, a data warehouse is always the best long-term solution. Analysis Services is the best technology for providing information to the user and providing the performance for ad-hoc queries, but there are still areas where the data warehouse and associated ETL process will be the best bet. Data quality is probably the most important reason for a data warehouse, because real-world source systems are never going to contain completely clean data. As you have seen in previous chapters, you can use a relational database and Integration Services to get around some thorny issues in the data, such as unpivoting columns into rows. Another important reason is to allow additional systems to be easily integratedwhen half your sales fact records need to start coming from the new ERP system that your company has just acquired, an adjustment to the Integration Services packages is all that is required. |
Business Benefits The solution will deliver the following benefits to the client: The solution will support the on-time delivery and profitability business initiatives by providing flexible analytical capabilities with the required subsecond response. Allowing end users to directly access the information they need will reduce the pressure on IT to deliver new reports all the time and will free up valuable resources to work on other projects.
|