7.3. Create a Report Layout Now that you have defined a data source and a model based on it, you will use Report Builder to create a tabular report. Click the Report Builder icon on the toolbar on the page displaying the data source and model built in the previous sections. If you are prompted with a Security Warning dialog, click Run to start Report Builder. The first time report builder runs, it will download the application from the report server before launching the application. Report Builder as it looks when it first starts is shown in the following figure. Figure 7-4. Report Builder 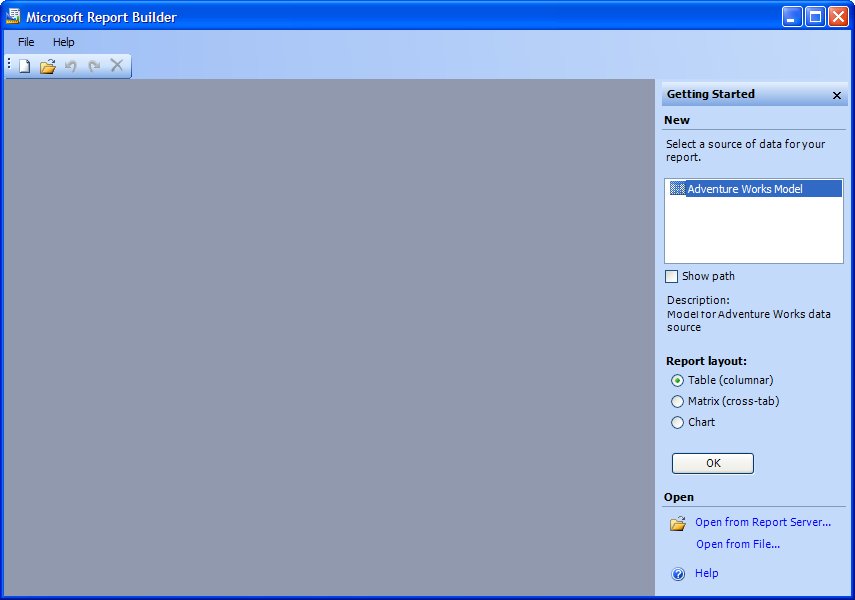
The IDE contains a Getting Started panel which in turn contains two sections:
New -
This section lets you create a new report. The section contains a list box showing the available report models including Adventure Works Model that you created in the preceding section. It also lets you specify the report layoutone of table, matrix, or chart. After you have specified the model and layout, press the OK button to create the report.
Open -
This section lets you open an existing report from either a report server or file. NOTE While you are working through the Report Builder example, you should examine the underlying database for the report model (in this case AdventureWorks) to better understand how the model abstracts complexities of the underlying data. Use SQL Server Management Studio or your favorite tool to examine the AdventureWorks database schema. Follow these steps to build a new report. Specify the report model on which the report is based. Select Adventure Works Model in the New section of the Getting Started pane. Specify a tabular report layout. Check the Table (columnar) radio button in the New section of the Getting Started pane. NOTE In addition to creating tabular reports, Report Builder lets you build reports with matrix and chart layouts by selecting the appropriate Report layout radio button in the New section of the Getting Started pane. The design and publishing process is similar to the process for creating a tabular report described in this example, but beyond the scope of this book. For more information about these layouts as well as information about more complex report types including drill-down and nested, see SQL Server Books Online. Press the OK button to generate a new, empty tabular report and to open the design surface you will use to define the report as shown in the following figure.
Figure 7-5. Report Builder: Explorer Pane and Design Surface 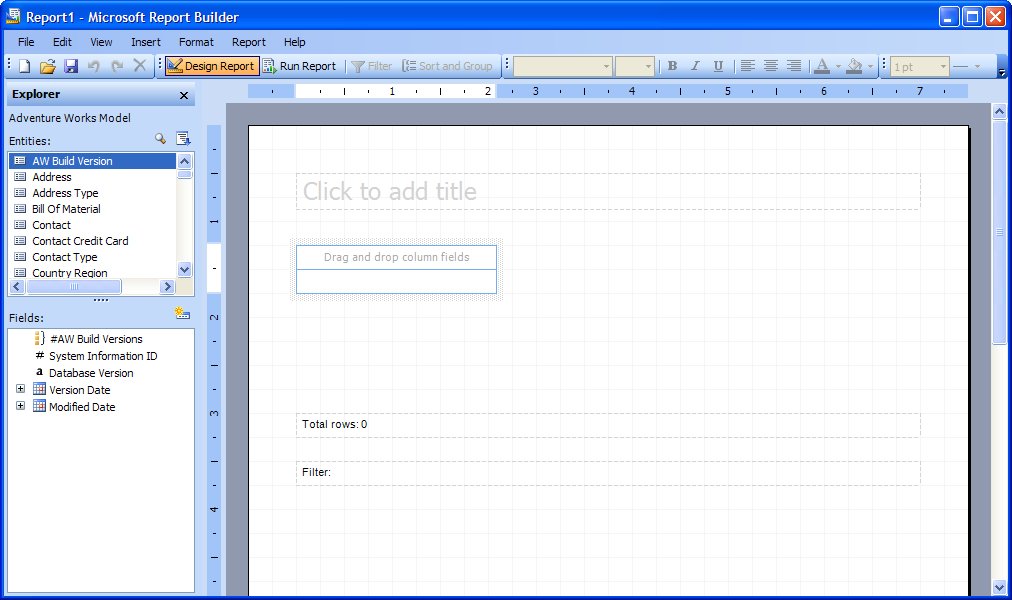
Report Builder displays: An Explorer pane that contains two list boxesEntities and Fieldsused to build the report. Entities are a collection of logical model items based on items in the database. Fields map to columns in database tables or to calculations based on columns. A design surface where you place entities and fields to define both the content and the layout of the report.
Let's start by creating a report that lists some employee information. Follow these steps: Change the title of the report to Employee List by clicking on and replacing the text Click to add title. Select an entity that the report is based on. Scroll down in the Entities list and click on Employee. Notice that the contents of the Fields list box updates to show entities for the Employee entity. Add a field to the report. Drag the National ID Number field from the Field list box onto the design surface and drop it into the panel containing the text Drag and drop column fields. Notice that the Entities list box is updated to reflect the data relationship constraints imposed on the report by adding the National ID Number field. Notice also that the Birth Date field is now bolded in the Field list box indicating that it is used in the report. If you make a mistake adding a field, right-click on the field on the design surface and select Delete from the context menu. Preview the report. Click on the Run Report button in the Report Builder toolbar. An empty report titled Employee List is generated. Click the Design Report toolbar button to return to the designer. NOTE You can switch back and forth between design and report views at any time to see progress and help you refine reports as you develop them. You must add at least one field to a report in order to view it. Add the birth month and day for the employee to the report. Drop the Birth Date field to the right of the National ID Number field on the design report. Let go of the mouse button when you see a large insert caret (blue by default) appear. Since the birth date can be sensitive, we want to display only the month and year. Click on the Birth Date field and right-click Format... from the context menu to display the Format dialog shown in the following figure. Figure 7-6. Format Dialog 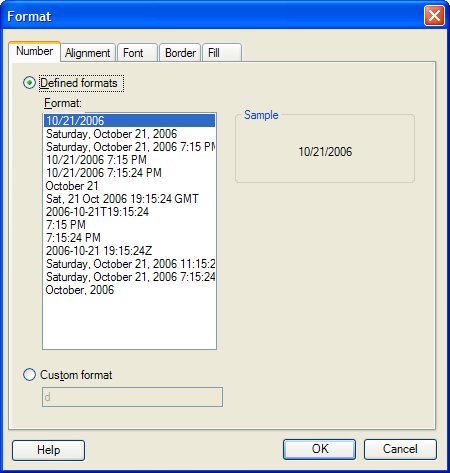 Select October 21 from the Format list box and click OK. Note that you can specify any valid .NET Framework format string. After you click OK, the format for the Birth Date field on the design surface is updated. Add the quarter that the employee was hired in to the report. Expand the Hire Date field in the Field list box. Select the Hire Quarter field (a function based on the Hire Date field that was automatically created in the model) and drop it to the right of the Birth Date field on the design surface. Format the Hire Quarter field so that it is prefixed with the letter Q on the report. We'll do this the hard way using a function instead of simply formatting the field (as we did with the Birth Date field in step 5). Right-click on the Birth Month field on the design surface and select Edit Formula... to bring up the Define Formula dialog shown in the following figure. Figure 7-7. Define Formula Dialog 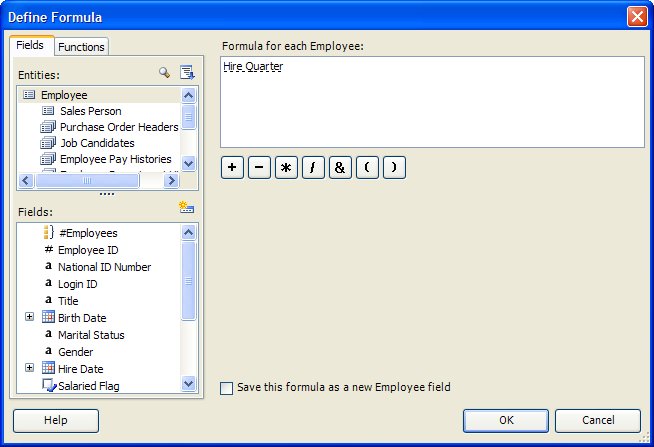 Next, select the Functions tab. Expand the Conversion node and you will see that there is a function TEXT that converts a number to a string. We will use this together with the concatenation operator &. Modify the text in the Formula for each Employee text box to read "Q" & TEXT(Hire Quarter). Note that Hire Quarter is a field (rather than simply a string) in the Formula for each Employee text box so you will need to prepend and append the formula text to it. Click OK to return to Report Builder. Notice that the Hire Quarter field has been renamed to Hire Quarter[2] column header on the design surface to prevent a name conflict. Click on the column header and edit it in place to remove the [2] suffix. Add employee contact information to the report. Select the Contact entity from the Entities list box. Notice that the Fields list box updates to show fields for the Contact entity. Drag the First Name field to the right of the Employee ID field on the design report. Drag the Last Name field to the right of the First Name field on the design surface. The completed report is shown in the following figure. Figure 7-8. Report Builder: Employee List Report 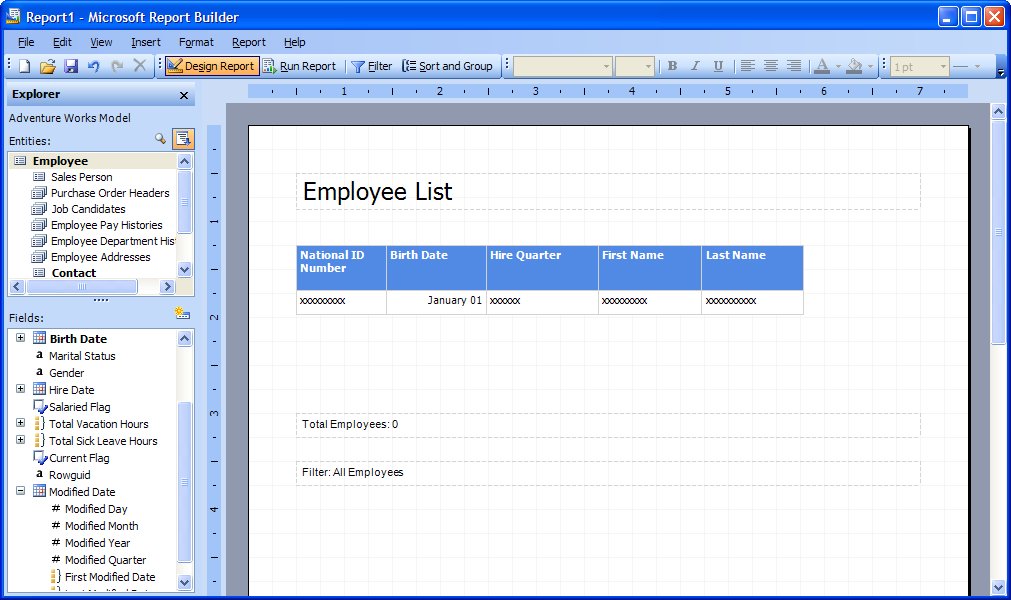
The report you've designed contains columns from both the underlying HumanResources.Employee table and the Person.Contact table using data relationships automatically identified from the database and added to the report model. Run the report by clicking the Run Report button in the Report Builder toolbar. The resulting report is shown in the following figureit's a simple report that automatically supports paging, navigation, printing, exporting (XML, CSV, TIFF, PDF, Web archive, and Excel), zooming, searching, and sorting (click on the arrows in the column headings). Figure 7-9. Report Builder: Employee List Report 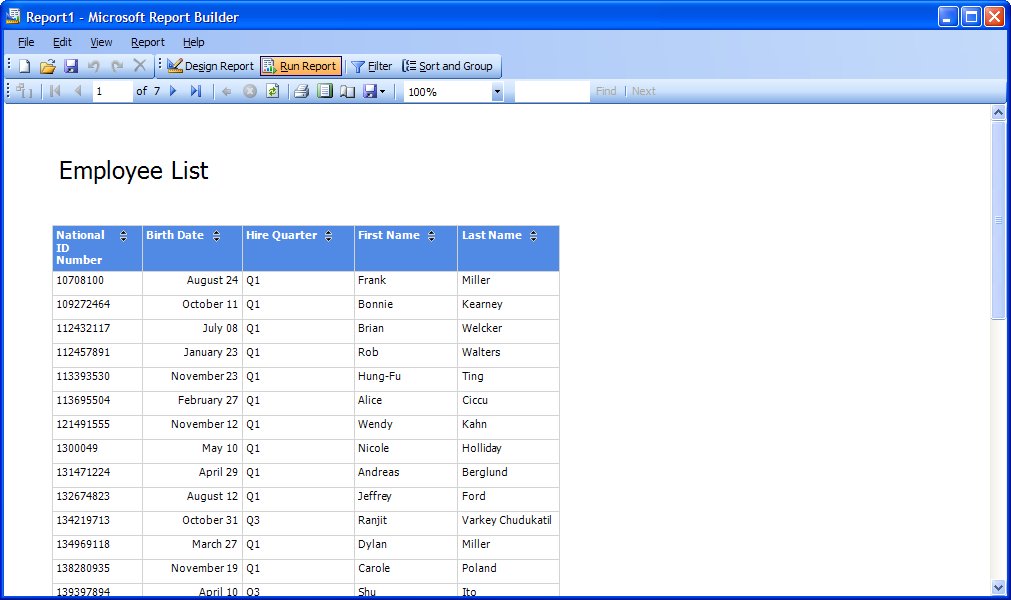
Next, we'll modify the report in this example to demonstrate grouping, totaling, sorting, and filtering. Return to the design view by clicking the Design Report button in the toolbar. Follow these steps. Use the Hire Quarter field to group data and calculate aggregates. Right-click on the Hire Quarter field on the design surface to select it. Drag it from the right of the Birth Date field and drop it to the left of the National ID Number field (making it the first field). Notice that a second group tab named Hire Quarter[2] appears to the left of the Employee Group tab. This behavior lets you easily group, subtotal, and organize hierarchies of data as we'll see next. Add a Total Sick Leave Hours column, displaying totals by Hire Quarter. Drag the Total Sick Leave Hours field from the Field list box onto the design surface and drop it to the right of the Last Name field. Report Builder automatically adds group totals as shown in the following figure. Figure 7-10. Report Builder: Employee List WithTotals 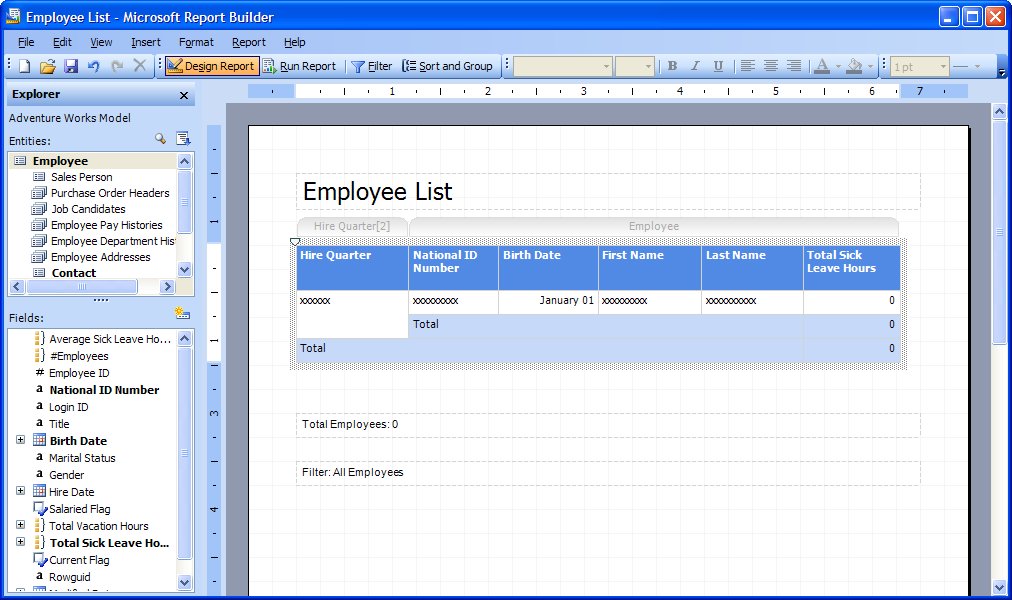 You control whether totals for a group are displayed by right-clicking a group tab and selecting or deselecting Show Group Subtotals on the context menu. Sort the report on the Hire Quarter and the National ID Number fields. Click the Sort and Group button on the Report Builder toolbar to display the Sort dialog box shown in the following figure. Figure 7-11. Report Builder Sort Dialog 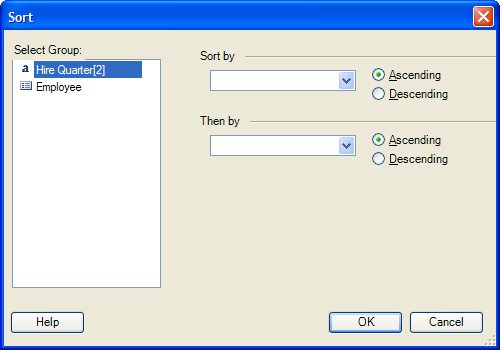 Select Hire Quarter[2] in the Select Group list box. Select Hire Quarter in the Sort by drop-down list. Select Employee in the Select Group list box. Select National ID Number in the Sort by drop-down list. Click OK to complete the sort definition, close the dialog, and return to Report Builder designer. Filter the report to include only employees with more than 60 hours. Click the Filter button on the Report Builder toolbar to display the Filter Data dialog. Drag the Sick Leave Hours field from the Fields list box and drop it onto the Employees with filter condition text box. (If you make a mistake, click on the field in the filter condition and select Remove Condition from the context menu.) Click equals (in the filter condition that you just added) and select Greater Than or Equals from the context menu. Select 60 from the to drop-down list. The completed Filter Data dialog is shown in the following figure. Figure 7-12. Report Builder: Filter Data Dialog 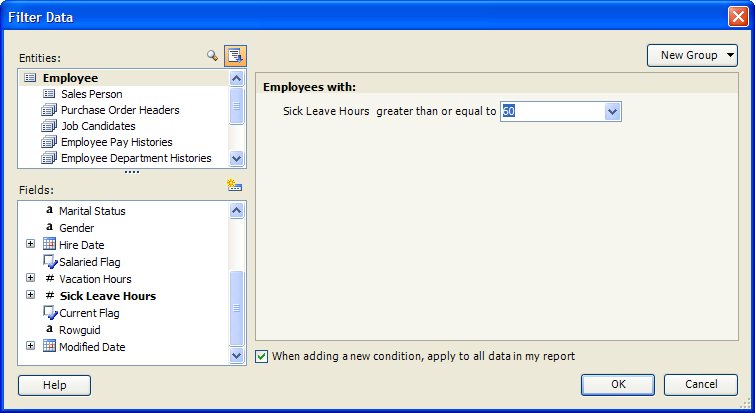 Click OK to return to Report Builder designer. Notice that the Filter Description at the bottom of the design surface reflects the filter you just applied.
Run the report and examine the effect of the grouping, totaling, sorting, and filtering. In the final part of this example, we will add additional aggregations at the report and group level. Follow these steps. Add the count of employees by quarter. Drag the #Employees expression field from the Fields list box onto the Hire Quarter[2] group tab. Add a calculation showing the average sick leave hours by employee. Define a new field by selecting Report  New Field... from the Report Builder menu. This opens an empty version of the Define Formula dialog box shown in the following figure. New Field... from the Report Builder menu. This opens an empty version of the Define Formula dialog box shown in the following figure. Figure 7-13. Report Builder: Define Formula Dialog 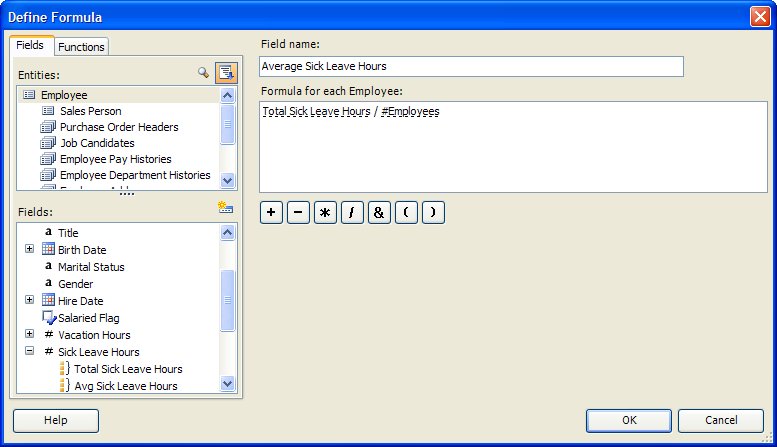 Complete the dialog as shown in the figureyou will need to expand the Sick Leave Hours field in the Fields list box to access the Total Sick Leave Hours expression. Click OK to return to the Report Builder designer. Notice the expression Average Sick Leave Hours has been added to the Fields list box. Drag the Average Sick Leave Hours field from the Field list box onto the Hire Quarter[2] group tab.
Run the report and notice that both the number of employees and the average sick leave hours are now calculated for each quarter and for the entire report. The bottom of the last page of the report is shown in the following figure. 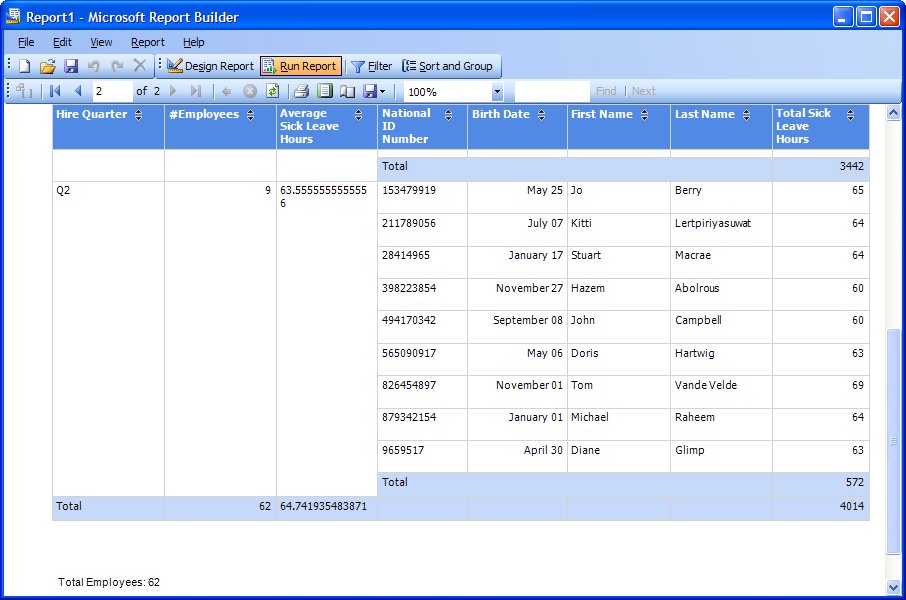 |