9-4. Analyzing Firewall Logs The most important thing you can do with a firewall is collect and analyze its Syslog information. Firewall logs should be inspected on a regular basis. Always make sure the Syslog collector or server is configured to archive older information and that disk space is not completely consumed. The Syslog collector or server should be sized according to the following parameters: The number of firewalls and other network devices sending Syslog messages to the Syslog server The number of Syslog events per second (usually called EPS) generated by all devices How long Syslog information should be kept available
Consider the type of information you want to get from your firewall logs. Here are some examples: Connections permitted by firewall rules Glancing through these messages can help you spot "holes" that remain open in your security policies. Connections denied by firewall rules You can instantly see what types of activity are being directed toward your secured inside network. Denied rule rates Using the ACE deny rate logging feature can show attacks that are occurring against your firewall. User activity Firewall user authentication and command usage can all be logged, providing an audit trail of security policy changes. Cut-through-proxy activity As end users authenticate and pass through the firewall, their activity can be logged for a general audit trail. Bandwidth usage Firewall logs can show each connection that was built and torn down, as well as the duration and traffic volume used. This can be broken down by connection, user, department, and so on. Protocol usage Firewall logs can show the protocols and port numbers that are used for each connection. Intrusion Detection System (IDS) activity A firewall can be configured with a set of IDS signatures and can log attacks that occur. Address translation audit trail If Network Address Translation (NAT) or Port Address Translation (PAT) is being used, the firewall logs can keep records of each translation that is built or torn down. This can be useful if you receive a report of malicious activity coming from inside your network toward the outside world. You can backtrack to find which internal user had a specific global IP address at a specific time.
You can scan the flat or raw Syslog data yourself to discover quite a few curious events or trends. However, if your firewall generates a large amount of logging information, you might want to invest in a firewall log analysis tool. You should choose a logging analysis application that is tailored for firewalls so that the connection and ACL messages (among many others) can be fully utilized. The following are some firewall logging analysis applications: CS-MARS from Cisco Systems (http://www.cisco.com) Network Intelligence Engine from Network Intelligence (http://www.network-intelligence.com) Network Security Analyzer and FirewallAnalyzer Enterprise from eIQnetworks (http://www.eiqnetworks.com) Sawmill Log Analyzer from FlowerFire (http://www.sawmill.net) CiscoWorks VPN and Security Management Solution (VMS) and Security Information Management Solution (SIMS) from Cisco Systems (http://www.cisco.com)
Consider the volume of Syslog information your firewalls and other network devices will generate. Syslog collection and analysis tools must be able to handle a sustained number of events per second so that no logging information is missed. They must also be able to store Syslog data over a reasonable period of time so that you can come back and analyze information from the recent past. You can get an idea of how many events per second a firewall generates without having a Syslog collector already in place. You can use the firewall's internal logging buffer as a gauge. Follow these steps: 1. | Enable logging to the buffer at a severity level:
Firewall(config)# logging buffered level
Here, the severity level is set to level (0 to 7): emergencies (0), alerts (1), critical (2), errors (3), warnings (4), notifications (5), informational (6), or debugging (7). The higher the level, the more messages (and types of messages) that are generated.
Set this to the level you think will generate the logging messages you are most interested in recording. When this command is executed, logging to the buffer begins immediately.
| 2. | Read the logging buffer counter as a baseline:
Firewall# show logging
Note when you issue this command. This begins the time period during which buffered logging is monitored.
The "n messages logged" counters can't be reset while the firewall is operational. Therefore, you can take a reading of the buffer logging message counter now as a starting point. The logging counters are shown in the first few lines of output. For PIX 7.x, you can use the show logging setting command to omit any output except settings and counters.
In the following example, the firewall begins with 460,864 messages that have already been sent to the buffer, because buffered logging has been active in the past.
Firewall# show logging Syslog logging: enabled Facility: 20 Timestamp logging: disabled Standby logging: disabled Console logging: disabled Monitor logging: disabled Buffer logging: level informational, 460864 messages logged Trap logging: level warnings, 1882119 messages logged Logging to outside 192.168.254.100 History logging: disabled Device ID: disabled
| 3. | Wait 1 minute and then see how many messages were sent to the buffer:
Firewall# show logging
Note the number of buffer messages logged now, and calculate the difference between this and the baseline number from Step 2. This is the number of messages generated at the desired severity level over the span of 60 seconds. Divide that by 60, and you have an estimate of events or messages per second (EPS).
In the following example, the firewall begins with 438,113 buffered messages. After 1 minute of buffered logging at severity level 6 (informational), the counter has risen to 460,864. 460,864 minus 438,113 equals 22,751 messages in one minute, or 379 messages per second.
Firewall# config term Firewall(config)# logging buffered informational Firewall(config)# exit Firewall# show logging Syslog logging: enabled Facility: 20 Timestamp logging: disabled Standby logging: disabled Console logging: disabled Monitor logging: disabled Buffer logging: level warnings, 438113 messages logged Trap logging: level warnings, 1882092 messages logged Logging to outside 192.168.254.100 History logging: disabled Device ID: disabled [after one minute] Firewall# show logging Syslog logging: enabled Facility: 20 Timestamp logging: disabled Standby logging: disabled Console logging: disabled Monitor logging: disabled Buffer logging: level informational, 460864 messages logged Trap logging: level warnings, 1882119 messages logged Logging to outside 192.168.254.100 History logging: disabled Device ID: disabled
|
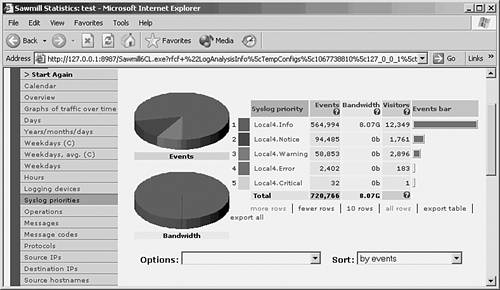
As you might expect, higher severity levels generate more logging messages. This is because the firewall reports on more types of normal activity. Higher severity levels actually mean that the events reported are less severe (more normal). Figure 9-3 shows a sample breakdown of the Syslog severity levels in messages that were collected over an hour from a firewall supporting an enterprise of several thousand users. Notice how the number of Local4.Critical (level 2) messages are few, progressing to the very large number of Local4.Info (level 6) messages. Figure 9-3. Sample Breakdown of Received Syslog Messages by Severity Level 
|
