Debugging Applications Outside VS .NET


If you're using Visual Studio .NET to develop your application, you can easily run your application within the debugger by choosing Debug > Start from the menu options, or by pressing the F5 key.

If you're using another editor, the .NET Framework SDK includes a visual debugger you can use that has the same capabilities as the Visual Studio .NET debugger.

To use the SDK debugger:

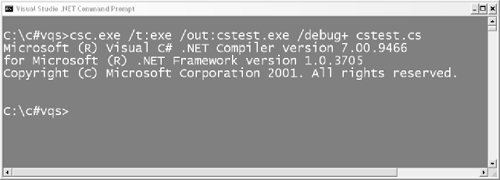
  1. Build your application with the debugging switch /debug+ . If your source code name is cstest.cs, then the line to run the command-line compiler would resemble the following: csc.exe /t:exe /out:cstest.exe /debug+ cstest.cs ( Figure 1.31 ).

    Figure 1.31. Compiling with the /debug+ has the effect of creating a debug file in addition to the executable. The debug file has the extension .pdb. The debugger uses this file to map the running program to the source code.

    graphics/01fig31.gif

  2. Change directories to: C:\Program Files\Microsoft.NET\FrameworkSDK\GuiDebug.

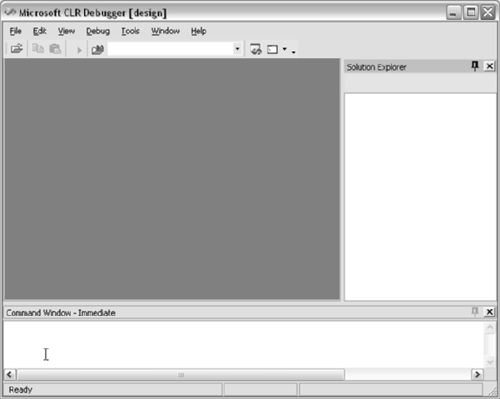
  3. Run DbgCLR.exe ( Figure 1.32 ).

    Figure 1.32. The .NET SDK ships with a visual debugger that has a similar look and feel to the debugger in Visual Studio .NET.

    graphics/01fig32.gif

  4. Choose Debug > Program to Debug.

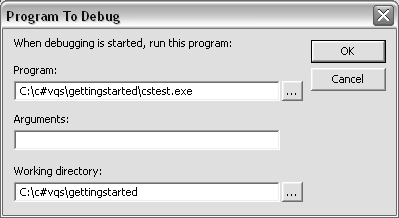
  5. Enter the path to the EXE you wish to debug in the program field. You can also search for the executable by clicking the [...] button next to the Program: field ( Figure 1.33 ).

    Figure 1.33. Enter the program you wish to debug. The debugger will run the program when you click the F11 key or the F5 key.

    graphics/01fig33.gif

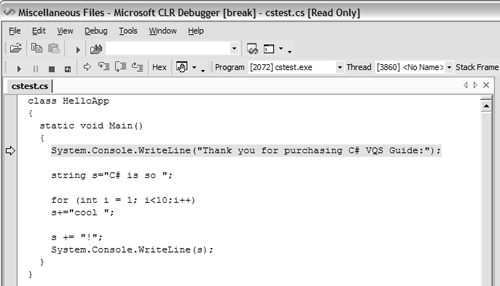
  6. Press F11 to step into the program. The debugger will open the source code for the program and stop at the first line ( Figure 1.34 ).

    Figure 1.34. If you press F11, the debugger will run your program and stop in the first line of source code. The line of source code will be highlighted in yellow.

    graphics/01fig34.gif

  7. To set a breakpoint in the source code, select the line where you wish the program to halt, and press the F9 key. The debugger will highlight the source code line in red.

  8. Press F11 to step into functions, F10 to step over functions, or F5 to run until the next breakpoint or until the end of the program.

graphics/tick.gif Tips

  • If the debugger won't let you place a breakpoint on the code, it is most likely because you didn't build your application with the /debug+ switch.

  • You can stop execution of the program by selecting Debug > Stop Debugging from the menu bar.


C#
C# & VB.NET Conversion Pocket Reference
ISBN: 0596003196
EAN: 2147483647
Year: 2003
Pages: 198
Authors: Jose Mojica

flylib.com © 2008-2017.
If you may any questions please contact us: flylib@qtcs.net