| You can also debug ASP .NET applications outside of Visual Studio .NET. That means that you can put breakpoints in your .aspx documents and have the program stop when the client requests that page. Then you can single-step through the code in the document. There is one small limitation with debugging ASP .NET applications both in VS .NET and outside of VS .NET, but debugging outside VS .NET makes it apparent. The application that runs your ASP .NET applications is ASPNET_WP.EXE. This program has to be run by the Web server (through the ISAPI extension) in order to work correctly. That means that you can't just ask the debugger to execute that application directly. Instead the debugger lets you attach it to a running instance of the application. For the ASPNET_WP.EXE program to be running with your ASP .NET application executing, you must use the Web browser to navigate to the application first. This will make ASPNET_WP.EXE run, then you can attach the debugger to ASPNET_WP.EXE and debug your pages. That limitation is unfortunate because it means you can't debug in scenarios where a client launches your application for the first time. To debug ASP .NET applications: -
Build your application with debug information. When you do this, the compiler creates another file with the extension .PDB that helps it associate the compiled code with the source code. As you execute the compiled program, the debugger can use this file to identify the source code that produced the machine code that is currently executing. You tell the compiler to add debug information by adding debug="true" to the page directive at the top of the page ( Figure 1.21 ). Figure 1.21 Putting the debug="true" attribute in the Page directive tells the ASP .NET compiler to compile your code with the /debug+ switch. This enables you to debug your aspx documents. <%@Page Language="c#" debug="true" %> -
Run Internet Explorer (or your Web browser of choice) and enter the URL for the first page in your application, for example: http://localhost/nameofdir/default.aspx . Don't close the browser after displaying the page. -
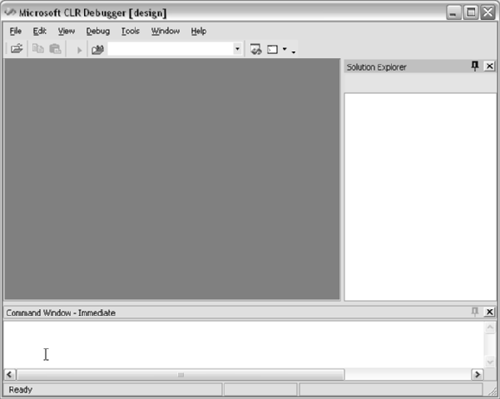
Run the .NET SDK debugger. To do so, choose Start > Run, then type "C:\Program Files\Microsoft.NET\FrameworkSDK\GuiDebug\DbgCLR.exe" if you installed the Framework SDK only. If you installed Visual Studio .NET, type "C:\Program Files\Microsoft Visual Studio .NET\FrameworkSDK\GuiDebug\DbgCLR.exe" ( Figure 1.22 ). Remember that when you enter paths with spaces and long names in the Run window you have to include quotation marks around the name . Figure 1.22. The .NET SDK debugger works equally well for ASP .NET applications and for stand-alone applications.  -
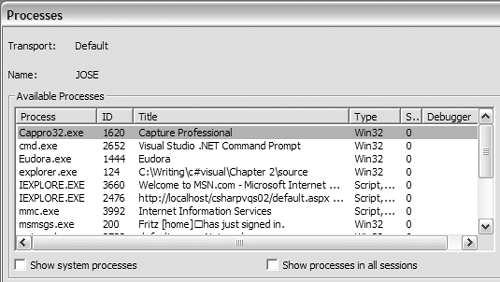
Choose Tools > Debug Process from the menu bar ( Figure 1.23 ). Figure 1.23. The processes dialog shows a list of running programs, including .NET programs and native (non-.NET) programs. However, the debugger only works with .NET code.  -
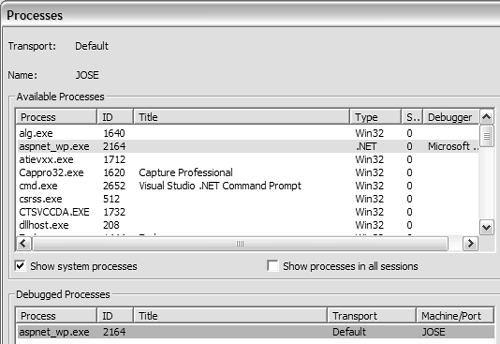
Double-click aspnet_wp.exe from the list. You should see aspnet_wp.exe appear in the Debugged Processes list ( Figure 1.24 ). Figure 1.24. aspnet_wp.exe is the process that hosts your Web applications. It will appear on the list after you run an ASP .NET application.  -
Click the Close button. -
Choose File > Open > File from the menu bar. -
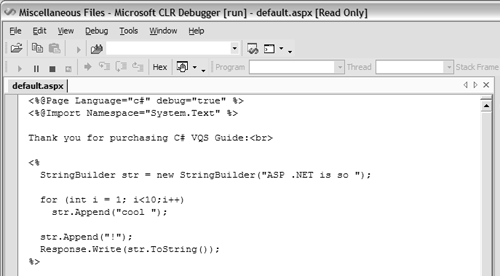
Find and select the aspx page you're viewing in your browser. The debugger should now display the source code for the aspx page ( Figure 1.25 ). Figure 1.25. You can open the source code file for any aspx page related to your application. Then you can put breakpoints in your code and have the debugger stop when a user requests the page.  -
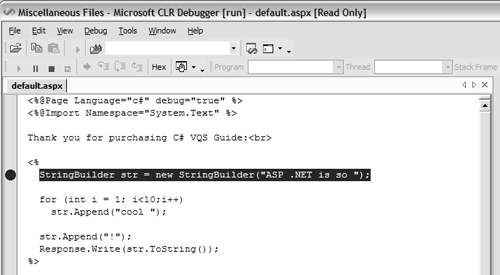
Select the first line of code and press F9 to place a breakpoint on that line. The debugger will highlight that line in red ( Figure 1.26 ). Figure 1.26. Once the source code is displayed in the debugger, you can place breakpoints by clicking on the line you wish to stop and pressing the F9 key. The debugger will highlight the line of code in red.  -
Go back to the Web browser and click the Refresh button. -
Switch back to DbgCLR.exe. You should see the first line highlighted in yellow, indicating that the program has halted. -
Press F11 to step into functions, F10 to step over functions, or F5 to run until the next breakpoint or until the end of the program.  Tips Tips -
If you stop the application from running (by selecting Debug > Stop Debugging) you will need to repeat the process of attaching to the running process ( starting at step 3). -
If you continue to run the program until it ends (by pressing F5) you don't have to re-attach. You can simply click the refresh button in the browser to stop once again at your breakpoint.
|
