Online DB2 Performance Monitors
| < Day Day Up > |
Online DB2 Performance MonitorsIn addition to a batch performance monitor such as DB2 PM, DB2 shops must also have an online performance monitor, which is a tool that provides real-time reporting on DB2 performance statistics as DB2 operates. In contrast, a batch performance monitor reads previously generated trace records from an input data set. Sometimes, a single product can serve both purposes. With online DB2 performance monitors, you can usually perform proactive performance management tasks . In other words, you can set up the monitor such that when it detects a problem it alerts a DBA and possibly takes actions on its own to resolve the problem. The leading DB2 online performance monitors are MainView from BMC Software (shown in Figure 24.2), Omegamon from Candle Corporation, and TMON from Allen Systems Group. Figure 24.2. MainView for DB2 (BMC Software). Traditional VTAM Performance MonitorsThe most common way to provide online performance monitoring capabilities is by online access to DB2 trace information in the MONITOR trace class. These tools are accessed directly through VTAM in the same way that CICS or TSO are accessed through VTAM. You generally specify OPX or OP n for the destination of the MONITOR trace. This way, you can place the trace records into a buffer that can be read using the IFI. Some online DB2 performance monitors also provide direct access to DB2 performance data by reading the control blocks of the DB2 and application address spaces. This type of monitoring provides a "window" to up-to-the-minute performance statistics while DB2 is running. This information is important if quick reaction to performance problems is required. Most online DB2 performance monitors provide a menu-driven interface accessible from TSO or VTAM. It enables online performance monitors to start and stop traces as needed based on the menu options chosen by the user . Consequently, you can reduce overhead and diminish the learning curve involved in understanding DB2 traces and their correspondence to performance reports . Following are some typical uses of online performance monitors. Many online performance monitors can establish effective exception-based monitoring. When specified performance thresholds are reached, triggers can offer notification and take action. For example, you could set a trigger when the number of lock suspensions for the TXN00002 plan is reached; when the trigger is activated, a message is sent to the console and a batch report is generated to provide accounting detail information for the plan. You can set any number of triggers for many thresholds. Following are suggestions for setting thresholds:
Online performance monitors can produce real-time EXPLAIN s for long-running SQL statements. If an SQL statement is taking a significant amount of time to process, an analyst can display the SQL statement as it executes and dynamically issue an EXPLAIN for the statement. Even as the statement executes, an understanding of why it is taking so long to run can be achieved. NOTE A complete discussion of the EXPLAIN statement is provided in the next chapter. Online performance monitors can also reduce the burden of monitoring more than one DB2 subsystem. Multiple DB2 subsystems can be tied to a single online performance monitor to enable monitoring of distributed capabilities, multiple production DB2s, or test and production DB2 subsystems, all from a single session. Some online performance monitors provide historical trending. These monitors track performance statistics and store them in DB2 tables or in VSAM files with a timestamp. They also provide the capability to query these stores of performance data to assist in the following:
Some monitors also run when DB2 is down to provide access to the historical data accumulated by the monitor. A final benefit of online DB2 performance monitors is their capability to interface with other MVS monitors for IMS/TM, CICS, MVS, or VTAM. This way, an analyst gets a view of the entire spectrum of system performance. Understanding and analyzing the data from each of these monitors, however, requires a different skill. Quite often, one person cannot master all these monitors. GUI Workstation Performance ManagementMany of the leading database tools vendors are offering GUI front-ends for their performance monitoring products. These products run on a workstation PC and connect to the mainframe to obtain performance trace information or to probe DB2 control blocks for performance statistics. Usually these performance management tools require separate portions to be installed on the server and the client. The server component constantly monitors and polls for predefined events; the client component provides console operations that accept alerts triggered by the server. In a DB2 environment, the z/OS (or OS/390) machine is the server; the client is typically a PC running Windows. In many cases, the tool vendors are basing their DB2 for z/OS GUI performance management tools on their popular management products for open systems DBMSs (such as Oracle and Microsoft SQL Server). A GUI product has advantages over a green-screen offering because more information can be presented on a single screen. The main screen acts as a dashboard (see Figure 24.3), delivering the high-level pertinent information to the DBA or performance analyst all on one console. Users can then drill down into more detailed information as desired, such as showing details about all active DB2 threads (see Figure 24.4). Figure 24.3. SmartDBA System Performance Console (BMC Software).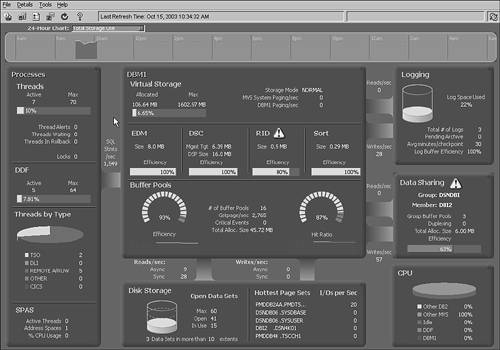 Figure 24.4. SmartDBA Active Thread Drill Down (BMC Software).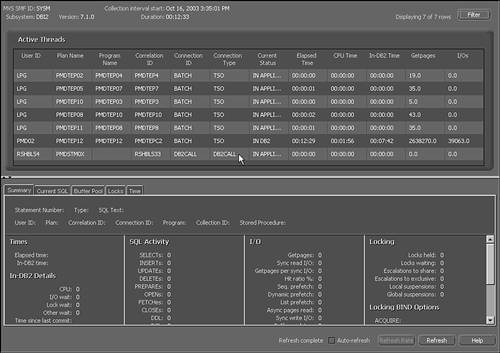 Examples of popular GUI-based performance monitors include BMC Software's SmartDBA and Quest Software's Quest Central. The screens shown in Figures 24.3 and 24.4 are examples of BMC's SmartDBA System Performance for DB2 offering. Online Performance Monitoring SummarySome vendors sell monitors in all these areas, providing a sort of seamless interface that can simplify movement from one type of monitoring to another. For example, if a DB2 monitor reports that a CICS transaction is experiencing a performance problem, being able to switch to a CICS monitor to further explore the situation would be beneficial. In Chapter 39, "Components of a Total DB2 Solution," I discuss online performance monitors for DB2 further and list several vendors that supply them. You also can write your own DB2 performance monitor using the Instrumentation Facility Interface (IFI) provided with DB2. However, you should not undertake this task unless you are a skilled system programmer willing to retool your home-grown monitor for every new release of DB2. |
| < Day Day Up > |
EAN: 2147483647
Pages: 388