Gathering Baseline Performance Data
| There are three good reasons to collect data on the baseline performance of your servers:
The only way to really know any of these three things is to have reliable data that you can use to relate one state to the other. You collect data on your servers so that you can establish a baselinethat is, a measured level of performance of that server at a point in time. A baseline study can include a number of key measurements, including the following:
When you benchmark a server, you establish the baseline for normal performance, or what passes for normal at that particular moment. If you don't know what "normal" is, then you are hard pressed to resolve problems when your system is behaving in a manner that isn't normal. The tools used to create benchmarks and establish baselines are system and event monitors. These tools create data that is written to a log file, and you can export that log file to a standard spreadsheet or database format for further analysis. You can use benchmarks for three tasks:
Benchmarking should be part of everyday administration practice because collecting meaningful data takes a long time. Modern operating system and application vendors build into their software useful tools for benchmarking, so you don't have to look far to find a tool that will help you get started. Solaris, NetWare, Windows, and others network operating systems come with their own performance monitor and event logging applications. These tools are included because they are among the first tools that developers need when they are creating the software you will eventually use. Most of the various performance monitors are configured for real-time analysis of a system. That is, they collect data on the CPU, disk, and so on. This occurs as often as several times a second to every few seconds so that the tools can display the current behavior of your system. Although that is useful when you want to know what's happening immediately in front of you, it is way too much data over much too short a time to be valuable when you are benchmarking your system. You need to change the default time interval in your performance monitor so that it collects only a few data points per hour so that your log file is able to maintain a meaningful record. For most purposes, you want to collect from 1 to around 20 data points for each hour. The number you should collect is a function of how representative of the condition the instantaneous measurement you are making is. If you are measuring something that varies over the course of a day, such as email traffic, then a measurement every 10 or 15 minutes will probably be sufficient. You should measure the growth of your log file and determine how much data is stored for each data point. Knowing the frequency and the size of each data point allows you to change the default log size so that you can collect a meaningful data set without the data being overwritten. When you are benchmarking a system, you should start a new benchmark log. Every change should also register an entry in your work diary so that you know when your system has changed and how. Significant changes include adding or removing software or hardware. Because those changes should alter your performance, creating a new benchmark log makes it easier to figure out where in the logs the changes were made. As a rule of thumb, you should consider starting a new benchmark log every time you might consider creating a restore point. Tip It's a good idea to start a notebook in which you put printouts of your trend and activity data over time. When it comes time to justify a server upgrade or you need to plan for additional equipment or set up a resource allocation, you have the information available at your fingertips. If your server room has gone paperless, consider using an Excel spreadsheet or other software tool (preferably a tool that allows you to create graphs). You should consider creating a new benchmark study whenever you have upgraded your server or creating a new log for each of the additional servers added to your system. Other changes, such as switching from 100BaseT to 1000BaseT (GigE) on your network or replacing a central network switch, are also good points at which to create a new benchmark study. Benchmarks are a little like backups. You should store a library of benchmarks for your future use, and you should preferably store those benchmarks on removable storage. Benchmarks are so valuable in planning and troubleshooting that you should protect them the same way you protect your company's documents. Operating systems provide two major tools to measure baseline activity: counters that measure performance by trapping events and an activity log of significant events that are trapped by your operating system or server application. You should create a baseline of the following components as a function of time:
These five factors are the measures of the critical system resources: processing, I/O throughput, storage resources, and the standard state of your server. When we say that you need a baseline as a function of time, we mean time in two dimensions: You need to establish the variation of your server's activity as a function of your organization's standard work cycle (usually a week) and how that standard work cycle is changing over the course of months and years. That information gives you a feeling for the normal variation in system resource usage, and it allows you to determine how that variation is trending. Using Windows Server 2003 Diagnostic ToolsWindows Server offers two primary diagnostic tools for servers: Performance Monitor and Windows Event Viewer. A third tool that you might want to use to diagnose your server is Network Monitor. All three of these tools are discussed in the following sections.
Windows Performance MonitorPerformance Monitor is a real-time monitoring tool that offers a wide range of counters for you to monitor. The utility is offered up as a graphical tool, most often shown in strip chart form, but you can configure it in several additional ways. When you run Performance Monitor, you can save the results to a file, and those results can be useful for tuning and for benchmarking studies. Figure 21.1 shows a sample run of Performance Monitor. Figure 21.1. A sample run of Performance Monitor.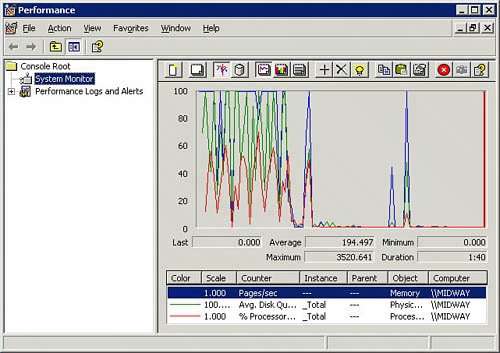 To open Performance Monitor, do one of the following:
Note Both Windows Performance Monitor and Windows Event Viewer are self-documented tools. That is, if you select their help commands, you find a relatively complete description on how to use these tools and the various capabilities they offer. Windows Event ViewerWindows Event Viewer is a window into the contents of the Windows event logs, and can be view within the Microsoft Management Console (MMC). This utility shows the logs in the left pane and the events in the right pane. To open Event Viewer, do either of the following:
The Event Viewer is a self-documented tool. If you open the Help system, you will find a detailed description of how to use the tool and what all the different symbols mean. In examining events, you should pay attention to not only error events but also the sequence in which events occur. The sequence of events is often an important clue as to what generated an error. The Windows event IDs are not always well described in the Event Viewer. Therefore, you may need to consult the Microsoft Knowledge Base or one of the websites devoted to Windows events in order to decode them. When you are finished with the Event Viewer, you can press Ctrl+F to close the program. Windows Network MonitorA third tool that you might want to use to diagnose your server is the Network Monitor, or netmon.
To open and view the Network Monitor, do either of the following:
With Network Monitor, you should be able to determine what the throughput levels for your NICs and determine how many errors your NIC sees. If you are getting a large number of network errors, you should follow up on it because it may indicate that you have either a configuration problem or a hardware problem. NICs sometimes fail, and when they do, they often don't just go deadthat would be too easy. When NICs fail, they get flaky first, perhaps dropping their connections at irregular intervals. Note If Network Monitor doesn't appear to be installed on your version of Windows Server or is missing drivers or other components, you may need to install it by using Add/Remove Software and specifying it in the Windows Components section. The version of Network Monitor found in Windows Server is not as complete as the version that ships with Windows SMS (Systems Management Server). Windows Server 2003's diagnostic tools are a capable, if not elegant, set of utilities for establishing system and networking benchmarks. The Performance tool (formerly called the Performance Monitor) can be used to create a strip chart that records various system parameters, not only on a per-server basis but on networks as well. You can often correlate the behaviors you see with events that you see in the event log. With Network Monitor, you can correlate the network traffic you see with network performance to determine the actual types of traffic, their origins, and their target on the network. Using Sun Solaris Diagnostic ToolsSolaris is replete with performance management tools, borrowing many from the UNIX bag of tricks and also including a few developed at Sun. Many of these tools are command-line tools, but you can find graphical utilities that you can either display the data in or redirect the data to. The following sections describe some of the most commonly used command-line tools.
The perfmeter CommandThe most obvious graphical tool is perfmeter, which is the Solaris performance monitor. Actually, perfmeter is an OpenWindows XView utility. perfmeter creates a graphical display of your system resource consumption, either in the form of a strip chart or as a set of analog dials. The following are some of the performance factors it measures:
While perfmeter is very useful for real-time analysis and troubleshooting, other UNIX commands are more useful for logging information to a file and for creating a baseline or benchmark study. One commonly used tool for measuring performance is the vmstat utility, which measures the use of virtual memory in a system. With vmstat you can determine how much your CPU is being utilized, the amount of disk swapping, the number of page faults, and the amount of memory usage. The vmstat command can use the following syntax: vmstat [-cipqsS] [disks] [interval[count]] You can use a number of switches with the vmstat command to get useful output, including the following:
For a more detailed explanation of the vmstat command, see the Solaris man pages at http://docs.sun.com/app/docs/doc/816-5166/6mbb1kqjv?a=view. The mpstat CommandThe second performance command you can use to measure processor performance in a multiprocessor Solaris system is mpstat. The syntax of this command is as follows: /usr/bin/mpstat [-a] [-p| -P set] [interval [ count]] The mpstat command returns a table of results of processor statistics. Each row in the table represents a single processor, and each column represents a different processor performance attribute. For a more detailed explanation of the mpstat command, you can view the Solaris man pages at http://docs.sun.com/app/docs/doc/816-5166/6mbb1kqjv?a=view. Note Keep in mind that there are often slight, and in rare cases significant, differences in the command syntax and the options and switches available in commands in different versions of UNIX. With mpstat, each processor is listed consecutively, and the command provides information on a number of factors. You can see your overall processor load, the number of interrupts used on each processor, the amount of processor time being used by each user, and how long each processor had to wait while an I/O was in progress. In a typical mpstat table, you might see the follow columns:
Which of these columns you see depends on what options and switches you used with the mpstat command. When you see a large difference in interrupts between processorssay a couple thousandyou can redistribute the load by moving your add-in cards around. The time a processor spends servicing a user's process should be around 85%. You should also see that the amount of time any processor has to wait should be less than around 20%. If you see that the processor spends more than 40% of its time waiting for an I/O operation to complete, you have a bottleneck in your I/O system. The iostat CommandYet another command-line utility is iostat (see http://docs.sun.com/app/docs/doc/816-0211/6m6nc6715?a=view), which measures the efficiency of a system's I/O. With iostat, you see a combined summary of activity in the first column, as you do with both vmstat and mpstat. The information listed is the activity since the last time your system started up, which is also true for vmstat and mpstat. The most valuable columns in the iostat command output are wait, actv, %b, and svc_t. Those columns describe the number of requests for disk writes in the queue, the number of requests pending in the disk volume, how busy the disk is in terms of a percentage, and the time it takes, in milliseconds, for any I/O request to be taken out of the queue and be processed. Note Each of the three commands vmstat, mpstat, and iostat is fully documented in the Solaris man files, and each has a number of switches that can modify the output of the command. The proc CommandIf you want to see what is actually using your system, then you should run a variant of the proc, or process, command. You can also see just the processes with the highest utilization by using the top command. There are three common uses of the proc command:
You will probably find that you need to use the | pipe in order to freeze the screen one screen at a time. The output of the proc command can be quite long and will scroll off your screen if you don't use |. The sar CommandSolaris has a command that can collect system information. The sar, or system activity report, command is turned off by default and must be enabled. You follow these steps to enable sar:
The sar command writes the data it collects into a set of files created daily and located at var/adm/sa. The files are consecutively numbered saxx, where xx is the day of the month. Unless you remove files that are a month old, they get overwritten by new files. sar output contains information that you can use to benchmark your system. Check the man page for sar for information on how to set the interval between data points, as found at http://docs.sun.com/app/docs/doc/816-5165/6mbb0m9rc?a=view. Using NetWare Diagnostic ToolsOn a NetWare server running ZENworks, you can set the threshold values for services in ConsoleOne and identify trends. You can also modify server files by using the Management Agent for NetWare or by using the Management Agent for Windows. Server agents record the initial values for thresholds and trends when they are installed. Whenever you add a new object to be monitored, NetWare creates a new trend file. You can view the trends in the NtrEND.INI file. When the management agents are running, you can use ConsoleOne to modify both the threshold and trend values. If your server reboots, ZENworks reestablishes the trends and thresholds, using the last values in the trend files. If the trend files are deleted or if a new monitored component is added to the server, the initial threshold and trends are reestablished. The trend file for NetWare is NtrEND.INI, and the trend file for Windows is N_NTtrEN.INI. The trend value sets the sample interval, which is the amount of time that goes by for which data is kept. A collection of trend data is called a trend bucket, and each line in the file is a separate data point. ZENworks allows you to alter the sample interval, enable or disable a trend file, and use a backup function to copy out your trend data. You should generally set a trend bucket to the length of your organization's standard work cycle. The following are some of the server management tasks that ZENworks for Servers (ZfS) offers:
ConsoleOne is similar to the MMC in terms of its organization. A two-panel window shows organizational or summary information on the left pane and detailed information in the right pane. Using Third-Party Benchmarking ToolsUsing benchmarking tools is a way to establish the relative performance of one system or platform against that of another. All sorts of benchmarks are available for you to measure server performance. Some tests are hardware-only measurements, while others measure a server running a particular operating system or an operating system/application coupling. Many benchmarks are free and easy to deploy, and others are costly both to purchase and to test against. There are many open and freely available benchmarks, some of which are distributed by industry standards groups such as SPEC, TPC, and Mindspring. As benchmarks get older, they are often released into the public domain either because the group sponsoring them has lost interest in them, gone defunct, or made the benchmark obsolete by producing another (usually more complex) test. You can find benchmarks that have been created by testing organizations, such as Ziff Davis's NetBench, ServerBench, and WebBench tests. Some very useful benchmarking tests are created by operating system vendors to help OEMs test their systems for capacity planning; Microsoft's MAPI Messaging Benchmark (MMB3) is an example. With an MMB3 workload for the LoadSim 20003 Exchange test suite (see www.microsoft.com/exchange/evaluation/performance/mmb3.mspx), it is possible to benchmark one Exchange server against another. Another example from Microsoft is the inetload tool for testing Web, proxy, caching, directory services, and messaging over Internet servers. Another test from Microsoft is the WCAT test. Table 21.1 lists some of the most commonly used server benchmarks.
Benchmarking is best done when you are comparing two or more systems under identical conditions. Most frequently, however, that is not the case. Moving from platform to platform, moving from application to application, and dealing with equipment modifications, even when they are minor, can skew the results of a benchmark toward one vendor or another. Therefore, several industry standards groups were formed to create tests that could be developed over time, lead to meaningful comparisons, and be policed when necessary. The following sections take a look at three of these standards and testing organizations: SPEC, TPC, and Mindcraft. SPECThe SPEC benchmarks (see www.spec.org) are a set of standardized tests that measure systems under what are meant to be real-world testing conditions. SPEC was originally formed as a cooperative in 1988 by several workstation vendors, and later it spun off as an independent corporation called the Standard Performance Evaluation Corporation. The goal of the SPEC tests, which are constantly under revision, is to establish a standard code base that allows different operating systems running on different equipment to be measured in a meaningful way, one against another. Most often you see SPEC benchmark results described for very high-end workstations, servers, and even supercomputers in an effort to set the performance record for a particular SPEC benchmark. SPEC benchmarks not only measure system performance, but they often set standards for price/performance standards as well. That's why companies like to quote the different SPEC results in their marketing information when it suits their purposes. There are currently SPEC benchmarks for the following systems and components:
The purchase price of SPEC benchmarks ranges from around $100 up to as much as $2,000. The disparity in pricing is due to the complexity of the work necessary to both create the benchmark as well as the personnel and equipment needed to verify compliance of the results. The problem with the SPEC benchmarks has been that they allow vendors to implement the tests in ways that favor their particular systems and thus they aren't as standardized as they might seem. However, this is by design. SPEC endeavors to allow vendors the freedom to run the benchmarks in a way that allows them to demonstrate the advantages of their system. So although the SPEC benchmark uses standard source code that is based on existing applications that have already been created by members of the organizations, it is up to the benchmarker to take the benchmark, compile the source code, and tune its system to obtain the best results. Thus there are inherent differences between test results. To consider how benchmarking might work, consider a test based on a specific webserver such as Apache. Apache exists on most major operating system platforms, and certainly on any of the ones you are likely to consider working with if you are reading this book. Although Apache's code is the same in any case, when you compile it for Linux, Solaris, HP-UX, or even Windows, you get different versions of the software. Even the compiler you use can make a slight difference in performance. That's the first level of differences. In addition, each vendor can tune its system so that it provides the best performance possible for that particular application. So if one vendor is smarter than another in how it tunes its disk system, that's yet another advantage. SPEC is replete with these potential advantages and disadvantages. Still, SPEC measures systems by using standard applications, and the results that vendors get are real results. So even if one vendor is able to achieve a new benchmark standard, that benchmark is a legitimate performance measurement. SPEC publishes several hundred of its members' benchmark results every year. TPCThe Transaction Processing Performance Council (TPC; see www.tpc.org) is an industry group that consists of nearly all the major server vendors. The tests that TPC sponsors focus on transaction processing and database benchmarks. These tests define a set of transactions that would be of interest to a business. The kind of transactions the tests create are meant to be similar to the ones you create when you withdrew money from a checking account at an ATM. Similar types of transactions are used to update a database system when you make an airline reservation or when a warehouse ships or purchases inventory items. In many large-scale enterprise deployments, TPC benchmarks are often requested. This is because TPC benchmarks simulate actual deployments and let a buyer evaluate a system as a whole rather than one subsystem at a time. Large government and corporate projects often request these tests for their larger systems, so many of the TPC benchmarks that are run are never published or publicized. In these instances, the vendor running the benchmark may choose to customize the benchmark to make it more suitable for the project that is being evaluated. As you might imagine, it's relatively easy for vendors to modify the TPC tests in ways that give their systems an unfair advantage over other vendors. The TPC has established a fair-use policy as well as an audit process to make sure that its benchmarks aren't misused. The TPC sponsors four main benchmarks:
Note To view the top 10 results for each of the TPC benchmarks, go to www.tpc.org/information/results.asp. TPC tests are often very involved affairs; not only are the tests relatively expensive to buy, but they can be very expensive to run. Vendors sometimes stage tests with million-dollar pieces of equipment, so it's not unheard of for some of the more involved tests, such as data warehousing tests, to run into six figures or more. However, when a server vendor is trying to sell a top-level business manager on a system that will run a significant part of his or her businessand often a mission-critical partmany vendors believe it is well worth spending the money. MindcraftMindcraft (see www.mindcraft.com) is an independent testing laboratory that was created in 1985 by people already involved with SPEC. Mindcraft does both contract benchmark testing and creates its own benchmarks. Among the tests that Mindcraft has developed are the following:
Mindcraft has become the repository of a number of older benchmarking standards that the company continues to develop. Several of these benchmarks are available in an open standard format, meaning that both the application and the source code are available for download. |
EAN: 2147483647
Pages: 240