Examining the Distribution
|
| < Day Day Up > |
|
You can examine the distributional properties of your data with the Distributions task. This task enables you to produce descriptive statistics for the variables, test the fit of several distributions to your data, and examine displays such as histograms and probability plots. In this task, interest lies in examining the birth and infant mortality rates for each region.
Request a Distributions Analysis
To request the Distributions task, follow these steps:
-
Select Statistics→ Descriptive → Distributionsb
-
Select birth and death as the analysis variables.
-
Select region as the classification variable.
Figure 7.12 displays the Distributions main dialog with the preceding variable specifications.
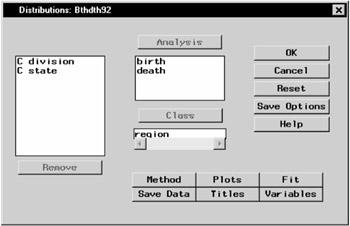
Figure 7.12: Distributions Dialog
The default analysis provides moments, quartiles, and measures of variability.
Request Plots
To request box-and-whisker plots and histograms, follow these steps:
-
Click on the Plots button.
-
Select Box-&-whisker plot.
-
Select Histogram.
-
Click OK.
Figure 7.13 displays the Plots dialog.
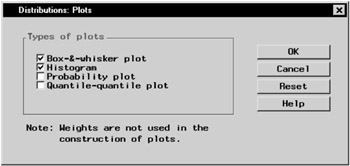
Figure 7.13: Distributions— Plots Dialog
Request Fitted Distribution
To fit a normal distribution to these data, follow these steps:
-
Click on the Fit button in the main dialog.
-
Select Normal.
By default, parameter values are calculated from the data when you fit the normal distribution. If you want to enter specific parameter values, click on the down arrow (displayed in Figure 7.14) and select Enter values. For the lognormal, exponential, and Weibull distributions, you can specify that parameters be calculated by maximum likelihood estimation (MLE), or you can enter specific parameter values.
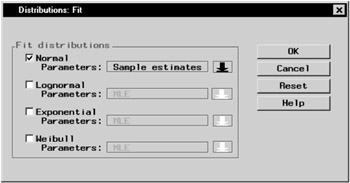
Figure 7.14: Distributions— Fit Dialog
-
Click OK.
When you have completed your selections, click OK in the main dialog to perform the analysis. The results are presented in the project tree displayed in Figure 7.15.
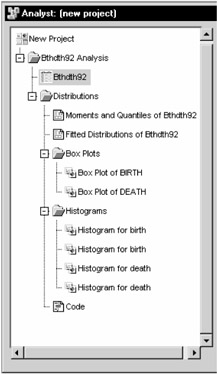
Figure 7.15: Distributions— Project Tree
Review the Results
Double-click on any of the resulting eight icons to display the corresponding output in a separate window.
The Moments and Quantiles output provides summary information for each variable. Figure 7.16 displays the output labeled Fitted Distributions of Bthdth92, which summarizes how closely the normal distribution fits each variable, by region.
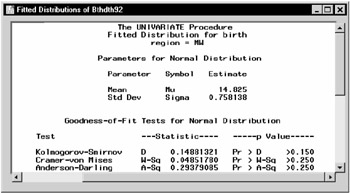
Figure 7.16: Distributions— Fitted Distributions Results
Based on the test results displayed in Figure 7.16, the null hypothesis that the variable birth is normally distributed cannot be rejected at the α = 0.05 level of significance (p-values for all tests are greater than 0.15). The same is true for the variable death except for the southern region (region='S'). The hypothesis is rejected at the α = 0.05 level of significance for the death rate in the southern region.
Two sets of box plots and four sets of histograms are also produced. A single box-and-whisker plot is created for each of the two variables. The box-and-whisker plot for the variable birth is displayed when you double-click Box Plot of BIRTH in the project tree.
Two histograms are created for each variable. Each graphic contains a histogram for two levels of the classification variable region. The first histogram contains the information for the midwestern and northeastern regions (region='MW' and region='NE'), as displayed in Figure 7.17. The second histogram (not shown) contains the information for the southern and western regions (region='S' and region='W').
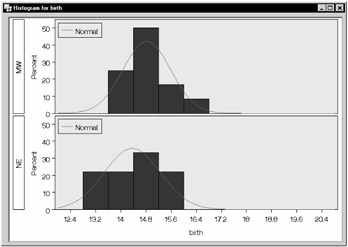
Figure 7.17: Distributions— Histogram for birth
The normal curve overlaid on the histogram displayed in Figure 7.17 is the result of requesting a normal distribution fit in the Fit dialog (Figure 7.14). The statistical details of the fit are located in the output labeled Fitted Distributions of Bthdth92, which also includes the details of the fit for the variable death.
|
| < Day Day Up > |
|
EAN: 2147483647
Pages: 116