Accessing Tasks and Help
|
| < Day Day Up > |
|
You can access tasks and help in Analyst by using the menus, the index, and the toolbar on Windows, or the toolbox on other operating systems.
Menus
You can use the menus in Analyst to accomplish a variety of tasks. Click on the pull-down menus at the top of the window, and select items with the mouse, or click the right mouse button within a window to display a pop-up menu. Most items are available from both the pop-up and pull-down menus.
-
From the File menu, you can access and save projects and data sets, and print reports.
-
From the Edit menu, you can switch data between Browse and Edit mode, and add, duplicate, and delete columns and rows.
-
From the View menu, you can move and hide columns, and view the attributes of the data table.
-
From the Tools menu, you can set the titles for your results, create sample data sets, specify viewer and graph preferences, and assign a new SAS library.
-
From the Data menu, you can filter, sort, summarize, concatenate, merge, transpose, and apply calculations to your data.
-
From the Reports menu, you can create detailed and summary reports.
-
From the Graphs menu, you can generate charts, plots, and histograms.
-
From the Statistics menu, you can choose statistical analyses and use the index to search for tasks or statistics.
-
From the Help menu, you can display help for Analyst and the rest of the SAS System.
Index
Use the index to access statistical and graphical tasks through commonly used terms. Select Statistics → Index...to display the Index of Tasks dialog. Click on a term to open a task, or type a term in the Search: field to find it in the list.
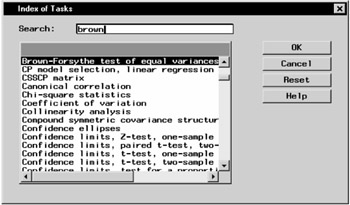
Figure 1.13: Index
For example, if you want to use the Brown-Forsythe test, click on Brown-Forsythe test of equal variances, click OK, and the One-Way ANOVA task is opened. The Brown-Forsythe test is available in the Tests dialog.
Toolbar
You can select an Analyst task from the toolbar or toolbox. Click on the icon for a task to select it. By default, the toolbar displays a range of tasks, from opening a file to performing a linear regression. You can display a description for each icon by dragging the mouse cursor over the toolbar. You can also add tasks to the toolbar. See Chapter 17, "Details," for more information.
![]()
Figure 1.14: Toolbar
Getting Help
You can get help in Analyst in three ways:
-
the Help menu
-
the Help button on a dialog
-
the Help icon in the toolbar
Help Menu
When Analyst is open, select Help → Using This Window to display help on Analyst. From the main window, Using This Window displays the table of contents for Analyst help. From other windows, Using This Window displays the help for that particular window. If you are on the Windows operating system, you can go to another help topic through the table of contents or the index.
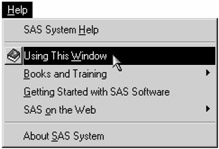
Figure 1.15: Help Menu
Help Button in Dialogs
Each dialog in Analyst has a Help button that you can click on to display the help for that task.
Help Icon on the Toolbar
Click on the Help icon ![]() on the toolbar to display the help table of contents for Analyst.
on the toolbar to display the help table of contents for Analyst.
|
| < Day Day Up > |
|
EAN: 2147483647
Pages: 116
- Chapter VII Objective and Perceived Complexity and Their Impacts on Internet Communication
- Chapter IX Extrinsic Plus Intrinsic Human Factors Influencing the Web Usage
- Chapter XII Web Design and E-Commerce
- Chapter XV Customer Trust in Online Commerce
- Chapter XVIII Web Systems Design, Litigation, and Online Consumer Behavior