Examples: REPORT Procedure
Example 1: Selecting Variables for a Report
Procedure features:
-
PROC REPORT statement options:
-
NOWD
-
-
COLUMN statement
-
default variable usage
-
-
RBREAK statement options:
-
DOL
-
SUMMARIZE
-
Other features:
-
FORMAT statement
-
FORMAT procedure:
-
LIBRARY=
-
-
SAS system options:
-
FMTSEARCH=
-
-
Automatic macro variables:
-
SYSDATE
-
This example uses a permanent data set and permanent formats to create a report that contains
-
one row for every observation
-
a default summary for the whole report.
Program
Declare the PROCLIB library. The PROCLIB library is used to store user -created formats.
libname proclib ' SAS-data-library ';
Set the SAS system options. The NODATE option suppresses the display of the date and time in the output. PAGENO= specifies the starting page number. LINESIZE= specifies the output line length, and PAGESIZE= specifies the number of lines on an output page.
options nodate pageno=1 linesize=64 pagesize=60;
Create the GROCERY data set. GROCERY contains one day s sales figures for eight stores in the Grocery Mart chain. Each observation contains one day s sales data for one department in one store.
data grocery; input Sector $ Manager $ Department $ Sales @@; datalines; se 1 np1 50 se 1 p1 100 se 1 np2 120 se 1 p2 80 se 2 np1 40 se 2 p1 300 se 2 np2 220 se 2 p2 70 nw 3 np1 60 nw 3 p1 600 nw 3 np2 420 nw 3 p2 30 nw 4 np1 45 nw 4 p1 250 nw 4 np2 230 nw 4 p2 73 nw 9 np1 45 nw 9 p1 205 nw 9 np2 420 nw 9 p2 76 sw 5 np1 53 sw 5 p1 130 sw 5 np2 120 sw 5 p2 50 sw 6 np1 40 sw 6 p1 350 sw 6 np2 225 sw 6 p2 80 ne 7 np1 90 ne 7 p1 190 ne 7 np2 420 ne 7 p2 86 ne 8 np1 200 ne 8 p1 300 ne 8 np2 420 ne 8 p2 125 ;
Create the $SCTRFMT., $MGRFMT., and $DEPTFMT. formats. PROC FORMAT creates permanent formats for Sector, Manager, and Department. The LIBRARY= option specifies a permanent storage location so that the formats are available in subsequent SAS sessions. These formats are used for examples throughout this section.
proc format library=proclib; value $sctrfmt 'se' = 'Southeast' 'ne' = 'Northeast' 'nw' = 'Northwest' 'sw' = 'Southwest'; value $mgrfmt '1' = 'Smith' '2' = 'Jones' '3' = 'Reveiz' '4' = 'Brown' '5' = 'Taylor' '6' = 'Adams' '7' = 'Alomar' '8' = 'Andrews' '9' = 'Pelfrey'; value $deptfmt 'np1' = 'Paper' 'np2' = 'Canned' 'p1' = 'Meat/Dairy' 'p2' = 'Produce'; run;
Specify the format search library. The SAS system option FMTSEARCH= adds the SAS data library PROCLIB to the search path that is used to locate formats.
options fmtsearch=(proclib);
Specify the report options. The NOWD option runs the REPORT procedure without the REPORT window and sends its output to the open output destination(s).
proc report data=grocery nowd;
Specify the report columns . The report contains a column for Manager, Department, and Sales. Because there is no DEFINE statement for any of these variables, PROC REPORT uses the character variables (Manager and Department) as display variables and the numeric variable (Sales) as an analysis variable that is used to calculate the sum statistic.
column manager department sales;
Produce a report summary. The RBREAK statement produces a default summary at the end of the report. DOL writes a line of equal signs (=) above the summary information. SUMMARIZE sums the value of Sales for all observations in the report.
rbreak after / dol summarize;
Select the observations to process. The WHERE statement selects for the report only the observations for stores in the southeast sector.
where sector='se';
Format the report columns. The FORMAT statement assigns formats to use in the report. You can use the FORMAT statement only with data set variables.
format manager $mgrfmt. department $deptfmt. sales dollar11.2;
Specify the titles. SYSDATE is an automatic macro variable that returns the date when the SAS job or SAS session began . The TITLE2 statement uses double rather than single quotation marks so that the macro variable resolves.
title 'Sales for the Southeast Sector'; title2 "for &sysdate"; run;
Output
Sales for the Southeast Sector 1 for 04JAN02 Manager Department Sales Smith Paper .00 Smith Meat/Dairy 0.00 Smith Canned 0.00 Smith Produce .00 Jones Paper .00 Jones Meat/Dairy 0.00 Jones Canned 0.00 Jones Produce .00 =========== 0.00
Example 2: Ordering the Rows in a Report
Procedure features:
-
PROC REPORT statement options:
-
COLWIDTH=
-
HEADLINE
-
HEADSKIP
-
SPACING=
-
-
BREAK statement options:
-
OL
-
SKIP
-
SUMMARIZE
-
-
COMPUTE statement arguments:
-
AFTER
-
-
DEFINE statement options:
-
ANALYSIS
-
FORMAT=
-
ORDER
-
ORDER=
-
SUM
-
-
ENDCOMP statement
-
LINE statement:
-
with quoted text
-
with variable values
-
Data set: GROCERY on page 963
Formats: $MGRFMT. and $DEPTFMT. on page 963
This example
-
arranges the rows alphabetically by the formatted values of Manager and the internal values of Department (so that sales for the two departments that sell nonperishable goods precede sales for the two departments that sell perishable goods)
-
controls the default column width and the spacing between columns
-
underlines the column headers and writes a blank line beneath the underlining
-
creates a default summary of Sales for each manager
-
creates a customized summary of Sales for the whole report.
Program
Declare the PROCLIB library. The PROCLIB library is used to store user-created formats.
libname proclib ' SAS-data-library ';
Set the SAS system options. The NODATE option suppresses the display of the date and time in the output. PAGENO= specifies the starting page number. LINESIZE= specifies the output line length, and PAGESIZE= specifies the number of lines on an output page. FMTSEARCH= specifies the library to include when searching for user-created formats.
options nodate pageno=1 linesize=64 pagesize=60 fmtsearch=(proclib);
Specify the report options. The NOWD option runs PROC REPORT without the REPORT window and sends its output to the open output destination(s). COLWIDTH=10 sets the default column width to 10 characters. SPACING= puts five blank characters between columns. HEADLINE underlines all column headers and the spaces between them at the top of each page of the report. HEADSKIP writes a blank line beneath the underlining that HEADLINE writes.
proc report data=grocery nowd colwidth=10 spacing=5 headline headskip;
Specify the report columns. The report contains a column for Manager, Department, and Sales.
column manager department sales;
Define the sort order variables. The values of all variables with the ORDER option in the DEFINE statement determine the order of the rows in the report. In this report, PROC REPORT arranges the rows first by the value of Manager (because it is the first variable in the COLUMN statement) and then by the values of Department.
ORDER= specifies the sort order for a variable. This report arranges the rows according to the formatted values of Manager and the internal values of Department (np1, np2, p1, and p2). FORMAT= specifies the formats to use in the report.
define manager / order order=formatted format=$mgrfmt.; define department / order order=internal format=$deptfmt.;
Define the analysis variable. Sum calculates the sum statistic for all observations that are represented by the current row. In this report each row represents only one observation. Therefore, the Sum statistic is the same as the value of Sales for that observation in the input data set. Using Sales as an analysis variable in this report enables you to summarize the values for each group and at the end of the report.
define sales / analysis sum format=dollar7.2;
Produce a report summary. This BREAK statement produces a default summary after the last row for each manager. OL writes a row of hyphens above the summary line. SUMMARIZE writes the value of Sales (the only analysis or computed variable) in the summary line. PROC REPORT sums the values of Sales for each manager because Sales is an analysis variable that is used to calculate the Sum statistic. SKIP writes a blank line after the summary line.
break after manager / ol summarize skip;
Produce a customized summary. This COMPUTE statement begins a compute block that produces a customized summary at the end of the report. The LINE statement places the quoted text and the value of Sales.sum (with the DOLLAR9.2 format) in the summary. An ENDCOMP statement must end the compute block.
compute after; line 'Total sales for these stores were: ' sales.sum dollar9.2; endcomp;
Select the observations to process. The WHERE statement selects for the report only the observations for stores in the southeast sector.
where sector='se';
Specify the title.
title 'Sales for the Southeast Sector'; run;
Output
Sales for the Southeast Sector 1 Manager Department Sales ----------------------------------- Jones Paper .00 Canned 0.00 Meat/Dairy 0.00 Produce .00 ------- -------- Jones 0.00 Smith Paper .00 Canned 0.00 Meat/Dairy 0.00 Produce .00 ------- -------- Smith 0.00 Total sales for these stores were: 0.00
Example 3: Using Aliases to Obtain Multiple Statistics for the Same Variable
Procedure features:
-
COLUMN statement:
-
with aliases
-
-
COMPUTE statement arguments:
-
AFTER
-
-
DEFINE statement options:
-
ANALYSIS
-
MAX
-
MIN
-
NOPRINT
-
customizing column headers
-
-
LINE statement:
-
pointer controls
-
quoted text
-
repeating a character string
-
variable values and formats
-
writing a blank line
-
Other features:
-
automatic macro variables:
-
SYSDATE
-
Data set: GROCERY on page 963
Formats: $MGRFMT. and $DEPTFMT. on page 963
The customized summary at the end of this report displays the minimum and maximum values of Sales over all departments for stores in the southeast sector. To determine these values, PROC REPORT needs the MIN and MAX statistic for Sales in every row of the report. However, to keep the report simple, the display of these statistics is suppressed.
Program
Declare the PROCLIB library. The PROCLIB library is used to store user-created formats.
libname proclib ' SAS-data-library ';
Set the SAS system options. The NODATE option suppresses the display of the date and time in the output. PAGENO= specifies the starting page number. LINESIZE= specifies the output line length, and PAGESIZE= specifies the number of lines on an output page. FMTSEARCH= specifies the library to include when searching for user-created formats.
options nodate pageno=1 linesize=64 pagesize=60 fmtsearch=(proclib);
Specify the report options. The NOWD option runs PROC REPORT without the REPORT window and sends its output to the open output destination(s). HEADLINE underlines all column headers and the spaces between them at the top of each page of the report. HEADSKIP writes a blank line beneath the underlining that HEADLINE writes.
proc report data=grocery nowd headline headskip;
Specify the report columns. The report contains columns for Manager and Department. It also contains three columns for Sales. The column specifications SALES=SALESMIN and SALES=SALESMAX create aliases for Sales. These aliases enable you to use a separate definition of Sales for each of the three columns.
column manager department sales sales=salesmin sales=salesmax;
Define the sort order variables. The values of all variables with the ORDER option in the DEFINE statement determine the order of the rows in the report. In this report, PROC REPORT arranges the rows first by the value of Manager (because it is the first variable in the COLUMN statement) and then by the values of Department. The ORDER= option specifies the sort order for a variable. This report arranges the values of Manager by their formatted values and arranges the values of Department by their internal values (np1, np2, p1, and p2). FORMAT= specifies the formats to use in the report. Text in quotation marks specifies column headings.
define manager / order order=formatted format=$mgrfmt. 'Manager'; define department / order order=internal format=$deptfmt. 'Department';
Define the analysis variable. The value of an analysis variable in any row of a report is the value of the statistic that is associated with it (in this case Sum), calculated for all observations that are represented by that row. In a detail report each row represents only one observation. Therefore, the Sum statistic is the same as the value of Sales for that observation in the input data set.
define sales / analysis sum format=dollar7.2 'Sales';
Define additional analysis variables for use in the summary. These DEFINE statements use aliases from the COLUMN statement to create separate columns for the MIN and MAX statistics for the analysis variable Sales. NOPRINT suppresses the printing of these statistics. Although PROC REPORT does not print these values in columns, it has access to them so that it can print them in the summary.
define salesmin / analysis min noprint; define salesmax / analysis max noprint;
Print a horizontal line at the end of the report. This COMPUTE statement begins a compute block that executes at the end of the report. The first LINE statement writes a blank line. The second LINE statement writes 53 hyphens (-), beginning in column 7. Note that the pointer control (@) has no effect on ODS destinations other than traditional SAS monospace output.
compute after; line ' '; line @7 53*'-';
Produce a customized summary. The first line of this LINE statement writes the text in quotation marks, beginning in column 7. The second line writes the value of Salesmin with the DOLLAR7.2 format, beginning in the next column. The cursor then moves one column to the right (+1), where PROC REPORT writes the text in quotation marks. Again, the cursor moves one column to the right, and PROC REPORT writes the value of Salesmax with the DOLLAR7.2 format. (Note that the program must reference the variables by their aliases.) The third line writes the text in quotation marks, beginning in the next column. Note that the pointer control (@) is designed for the Listing destination (traditional SAS output). It has no effect on ODS destinations other than traditional SAS monospace output. The ENDCOMP statement ends the compute block.
line @7 ' Departmental sales ranged from' salesmin dollar7.2 +1 'to' +1 salesmax dollar7.2 '. '; line @7 53*'-'; endcomp;
Select the observations to process. The WHERE statement selects for the report only the observations for stores in the southeast sector.
where sector='se';
Specify the titles. SYSDATE is an automatic macro variable that returns the date when the SAS job or SAS session began. The TITLE2 statement uses double rather than single quotation marks so that the macro variable resolves.
title 'Sales for the Southeast Sector'; title2 "for &sysdate"; run;
Output
Sales for the Southeast Sector 1 for 04JAN02 Manager Department Sales ----------------------------- Jones Paper .00 Canned 0.00 Meat/Dairy 0.00 Produce .00 Smith Paper .00 Canned 0.00 eat/Dairy 0.00 Produce .00 ------------------------------------------------------ Departmental sales ranged from .00 to 0.00. ------------------------------------------------------
Example 4: Consolidating Multiple Observations into One Row of a Report
Procedure features:
-
BREAK statement options:
-
OL
-
SKIP
-
SUMMARIZE
-
SUPPRESS
-
-
CALL DEFINE statement
-
Compute block
-
associated with a data set variable
-
-
COMPUTE statement arguments:
-
AFTER
-
a data set variable as report-item
-
-
DEFINE statement options:
-
ANALYSIS
-
GROUP
-
SUM
-
customizing column headers
-
-
LINE statement:
-
quoted text
-
variable values
-
Data set: GROCERY on page 963
Formats: $MGRFMT. and $DEPTFMT. on page 963
This example creates a summary report that
-
consolidates information for each combination of Sector and Manager into one row of the report
-
contains default summaries of sales for each sector
-
contains a customized summary of sales for all sectors
-
uses one format for sales in detail rows and a different format in summary rows
-
uses customized column headers.
Program
Declare the PROCLIB library. The PROCLIB library is used to store user-created formats.
libname proclib ' SAS-data-library ';
Set the SAS system options. The NODATE option suppresses the display of the date and time in the output. PAGENO= specifies the starting page number. LINESIZE= specifies the output line length, and PAGESIZE= specifies the number of lines on an output page. FMTSEARCH= specifies the library to include when searching for user-created formats.
options nodate pageno=1 linesize=64 pagesize=60 fmtsearch=(proclib);
Specify the report options. The NOWD option runs PROC REPORT without the REPORT window and sends its output to the open output destination(s). HEADLINE underlines all column headings and the spaces between them at the top of each page of the report. HEADSKIP writes a blank line beneath the underlining that HEADLINE writes.
proc report data=grocery nowd headline headskip;
Specify the report columns. The report contains columns for Sector, Manager, and Sales.
column sector manager sales;
Define the group and analysis variables. In this report, Sector and Manager are group variables. Sales is an analysis variable that is used to calculate the Sum statistic. Each detail row represents a set of observations that have a unique combination of formatted values for all group variables. The value of Sales in each detail row is the sum of Sales for all observations in the group. FORMAT= specifies the format to use in the report. Text in quotation marks in a DEFINE statement specifies the column heading.
define sector / group format=$sctrfmt. 'Sector'; define manager / group format=$mgrfmt. 'Manager'; define sales / analysis sum format=comma10.2 'Sales';
Produce a report summary. This BREAK statement produces a default summary after the last row for each sector. OL writes a row of hyphens above the summary line. SUMMARIZE writes the value of Sales in the summary line. PROC REPORT sums the values of Sales for each manager because Sales is an analysis variable used to calculate the Sum statistic. SUPPRESS prevents PROC REPORT from displaying the value of Sector in the summary line. SKIP writes a blank line after the summary line.
break after sector / ol summarize suppress skip;
Produce a customized summary. This compute block creates a customized summary at the end of the report. The LINE statement writes the quoted text and the value of Sales.sum (with a format of DOLLAR9.2) in the summary. An ENDCOMP statement must end the compute block.
compute after; line 'Combined sales for the northern sectors were ' sales.sum dollar9.2 '.'; endcomp;
Specify a format for the summary rows. In detail rows, PROC REPORT displays the value of Sales with the format that is specified in its definition (COMMA10.2). The compute block specifies an alternate format to use in the current column on summary rows. Summary rows are identified as a value other than a blank for _BREAK_.
compute sales; if _break_ ne ' ' then call define(_col_,"format","dollar11.2"); endcomp;
Select the observations to process. The WHERE statement selects for the report only the observations for stores in the northeast and northwest sectors. The TITLE statement specifies the title.
where sector contains 'n';
Specify the title.
title 'Sales Figures for Northern Sectors'; run;
Output
Sales Figures for Northern Sectors 1 Sector Manager Sales ------------------------------ Northeast Alomar 786.00 Andrews 1,045.00 ---------- ,831.00 Northwest Brown 598.00 Pelfrey 746.00 Reveiz 1,110.00 ---------- ,454.00 Combined sales for the northern sectors were ,285.00.
Example 5: Creating a Column for Each Value of a Variable
Procedure features:
-
PROC REPORT statement options:
-
SPLIT=
-
-
BREAK statement options:
-
SKIP
-
-
COLUMN statement:
-
stacking variables
-
-
COMPUTE statement arguments:
-
with a computed variable as report-item
-
AFTER
-
-
DEFINE statement options:
-
ACROSS
-
ANALYSIS
-
COMPUTED
-
SUM
-
-
LINE statement:
-
pointer controls
-
Data set: GROCERY on page 963
Formats: $SCTRFMT., $MGRFMT., and $DEPTFMT. on page 963
The report in this example
-
consolidates multiple observations into one row
-
contains a column for each value of Department that is selected for the report (the departments that sell perishable items)
-
contains a variable that is not in the input data set
-
uses customized column headers, some of which contain blank lines
-
double-spaces between detail rows
-
uses pointer controls to control the placement of text and variable values in a customized summary.
Program
Declare the PROCLIB library. The PROCLIB library is used to store user-created formats.
libname proclib ' SAS-data-library ';
Set the SAS system options. The NODATE option suppresses the display of the date and time in the output. PAGENO= specifies the starting page number. LINESIZE= specifies the output line length, and PAGESIZE= specifies the number of lines on an output page. FMTSEARCH= specifies the library to include when searching for user-created formats.
options nodate pageno=1 linesize=64 pagesize=60 fmtsearch=(proclib);
Specify the report options. The NOWD option runs PROC REPORT without the REPORT window and sends its output to the open output destination(s). HEADLINE underlines the column headings. HEADSKIP writes a blank line beneath the underlining that HEADLINE writes. SPLIT= defines the split character as an asterisk (*) because the default split character (/) is part of the name of a department.
proc report data=grocery nowd headline headskip split='*';
Specify the report columns. Department and Sales are separated by a comma in the COLUMN statement, so they collectively determine the contents of the column that they define. Each item generates a header, but the header for Sales is set to blank in its definition. Because Sales is an analysis variable, its values fill the cells that are created by these two variables.
column sector manager department,sales perish;
Define the group variables. In this report, Sector and Manager are group variables. Each detail row of the report consolidates the information for all observations with the same values of the group variables. FORMAT= specifies the formats to use in the report. Text in quotation marks in the DEFINE statements specifies column headings. These statements illustrate two ways to write a blank line in a column header. 'Sector' '' writes a blank line because each quoted string is a line of the column heading. The two adjacent quotation marks write a blank line for the second line of the heading. 'Manager* ' writes a blank line because the split character (*) starts a new line of the heading. That line contains only a blank.
define sector / group format=$sctrfmt. 'Sector' ''; define manager / group format=$mgrfmt. 'Manager* ';
Define the across variable. PROC REPORT creates a column and a column heading for each formatted value of the across variable Department. PROC REPORT orders the columns by these values. PROC REPORT also generates a column heading that spans all these columns. Quoted text in the DEFINE statement for Department customizes this heading. In traditional (monospace) SAS output, PROC REPORT expands the heading with underscores to fill all columns that are created by the across variable.
define department / across format=$deptfmt. '_Department_';
Define the analysis variable. Sales is an analysis variable that is used to calculate the sum statistic. In each case, the value of Sales is the sum of Sales for all observations in one department in one group. (In this case, the value represents a single observation.)
define sales / analysis sum format=dollar11.2 ' ';
Define the computed variable. The COMPUTED option indicates that PROC REPORT must compute values for Perish. You compute the variable s values in a compute block that is associated with Perish.
define perish / computed format=dollar11.2 'Perishable*Total';
Produce a report summary. This BREAK statement creates a default summary after the last row for each value of Manager. The only option that is in use is SKIP, which writes a blank line. You can use this technique to double-space in many reports that contains a group or order variable.
break after manager / skip;
Calculate values for the computed variable. This compute block computes the value of Perish from the values for the Meat/Dairy department and the Produce department. Because the variables Sales and Department collectively define these columns, there is no way to identify the values to PROC REPORT by name. Therefore, the assignment statement uses column numbers to unambiguously specify the values to use. Each time PROC REPORT needs a value for Perish, it sums the values in the third and fourth columns of that row of the report.
compute perish; perish=sum(_c3_, _c4_); endcomp;
Produce a customized summary. This compute block creates a customized summary at the end of the report. The first LINE statement writes 57 hyphens (-) starting in column 4. Subsequent LINE statements write the quoted text in the specified columns and the values of the variables _C3_, _C4_, and _C5_ with the DOLLAR11.2 format. Note that the pointer control (@) is designed for the Listing destination. It has no effect on ODS destinations other than traditional SAS monospace output.
compute after; line @4 57*'-'; line @4 ' Combined sales for meat and dairy : ' @46 _c3_ dollar11.2 ' '; line @4 ' Combined sales for produce : ' @46 _c4_ dollar11.2 ' '; line @4 '' @60 ''; line @4 ' Combined sales for all perishables: ' @46 _c5_ dollar11.2 ' '; line @4 57*'-'; endcomp;
Select the observations to process. The WHERE statement selects for the report only the observations for departments p1 and p2 in stores in the northeast or northwest sector.
where sector contains 'n' and (department='p1' or department='p2');
Specify the title.
title 'Sales Figures for Perishables in Northern Sectors'; run;
Output
Sales Figures for Perishables in Northern Sectors 1 _______Department_______ Sector Manager Meat/Dairy Produce Perishable Total --------------------------------------------------------- Northeast Alomar 0.00 .00 6.00 Andrews 0.00 5.00 5.00 Northwest Brown 0.00 .00 3.00 Pelfrey 5.00 .00 1.00 Reveiz 0.00 .00 0.00 --------------------------------------------------------- Combined sales for meat and dairy : ,545.00 Combined sales for produce : 0.00 Combined sales for all perishables: ,935.00 ---------------------------------------------------------
Example 6: Displaying Multiple Statistics for One Variable
Procedure features:
-
PROC REPORT statement options:
-
LS=
-
PS=
-
-
COLUMN statement:
-
specifying statistics for stacked variables
-
-
DEFINE statement options:
-
FORMAT=
-
GROUP
-
ID
-
Data set: GROCERY on page 963
Formats: $MGRFMT. on page 963
The report in this example displays six statistics for the sales for each manager s store. The output is too wide to fit all the columns on one page, so three of the statistics appear on the second page of the report. In order to make it easy to associate the statistics on the second page with their group, the report repeats the values of Manager and Sector on every page of the report.
Program
Declare the PROCLIB library. The PROCLIB library is used to store user-created formats.
libname proclib ' SAS-data-library ';
Set the SAS system options. The NODATE option suppresses the display of the date and time in the output. PAGENO= specifies the starting page number. LINESIZE= specifies the output line length, and PAGESIZE= specifies the number of lines on an output page. FMTSEARCH= specifies the library to include when searching for user-created formats.
options nodate pageno=1 linesize=80 pagesize=60 fmtsearch=(proclib);
Specify the report options. The NOWD option runs PROC REPORT without the REPORT window and sends its output to the open output destination(s). HEADLINE underlines all column headings and the spaces between them at the top of each page of the report. HEADSKIP writes a blank line beneath the underlining that HEADLINE writes. LS= sets the line size for the report to 66, and PS= sets the page size to 18.
proc report data=grocery nowd headline headskip ls=66 ps=18;
Specify the report columns. This COLUMN statement creates a column for Sector, Manager, and each of the six statistics that are associated with Sales.
column sector manager (Sum Min Max Range Mean Std),sales;
Define the group variables and the analysis variable. ID specifies that Manager is an ID variable. An ID variable and all columns to its left appear at the left of every page of a report. In this report, Sector and Manager are group variables. Each detail row of the report consolidates the information for all observations with the same values of the group variables. FORMAT= specifies the formats to use in the report.
define manager / group format=$mgrfmt. id; define sector / group format=$sctrfmt.; define sales / format=dollar11.2 ;
Specify the title.
title 'Sales Statistics for All Sectors; run;
Output
Sales Statistics for All Sectors 1 Sum Min Max Sector Manager Sales Sales Sales --------------------------------------------------------- Northeast Alomar 6.00 .00 0.00 Andrews ,045.00 5.00 0.00 Northwest Brown 8.00 .00 0.00 Pelfrey 6.00 .00 0.00 Reveiz ,110.00 .00 0.00 Southeast Jones 0.00 .00 0.00 Smith 0.00 .00 0.00 Southwest Adams 5.00 .00 0.00 Taylor 3.00 .00 0.00
Sales Statistics for All Sectors 2 Range Mean Std Sector Manager Sales Sales Sales --------------------------------------------------------- Northeast Alomar 4.00 6.50 6.57 Andrews 5.00 1.25 7.83 Northwest Brown 5.00 9.50 5.44 Pelfrey 5.00 6.50 0.39 Reveiz 0.00 7.50 8.61 Southeast Jones 0.00 7.50 3.39 Smith .00 .50 .86 Southwest Adams 0.00 3.75 1.86 Taylor .00 .25 .65
Example 7: Storing and Reusing a Report Definition
Procedure features:
-
PROC REPORT statement options:
-
NAMED
-
OUTREPT=
-
REPORT=
-
WRAP
-
Other features:
-
TITLE statement
-
WHERE statement
Data set: GROCERY on page 963
Formats: $SCTRFMT., $MGRFMT. and $DEPTFMT. on page 963
The first PROC REPORT step in this example creates a report that displays one value from each column of the report, using two rows to do so, before displaying another value from the first column. (By default, PROC REPORT displays values for only as many columns as it can fit on one page. It fills a page with values for these columns before starting to display values for the remaining columns on the next page.)
Each item in the report is identified in the body of the report rather than in a column header.
The report definition created by the first PROC REPORT step is stored in a catalog entry. The second PROC REPORT step uses it to create a similar report for a different sector of the city.
Program to Store a Report Definition
Declare the PROCLIB library. The PROCLIB library is used to store user-created formats.
libname proclib ' SAS-data-library ';
Set the SAS system options. The NODATE option suppresses the display of the date and time in the output. PAGENO= specifies the starting page number. LINESIZE= specifies the output line length, and PAGESIZE= specifies the number of lines on an output page. FMTSEARCH= specifies the library to include when searching for user-created formats.
options nodate pageno=1 linesize=80 pagesize=60 fmtsearch=(proclib);
Specify the report options. The NOWD option runs PROC REPORT without the REPORT window and sends its output to the open output destination(s). NAMED writes name= in front of each value in the report, where name= is the column heading for the value. When you use NAMED, PROC REPORT suppresses the display of column headings at the top of each page.
proc report data=grocery nowd named wrap ls=64 ps=36 outrept=proclib.reports.namewrap;
Specify the report columns. The report contains a column for Sector, Manager, Department, and Sales.
column sector manager department sales;
Define the display and analysis variables. Because no usage is specified in the DEFINE statements, PROC REPORT uses the defaults. The character variables (Sector, Manager, and Department) are display variables. Sales is an analysis variable that is used to calculate the sum statistic. FORMAT= specifies the formats to use in the report.
define sector / format=$sctrfmt.; define manager / format=$mgrfmt.; define department / format=$deptfmt.; define sales / format=dollar11.2;
Select the observations to process. A report definition might differ from the SAS program that creates the report. In particular, PROC REPORT stores neither WHERE statements nor TITLE statements.
where manager='1';
Specify the title. SYSDATE is an automatic macro variable that returns the date when the SAS job or SAS session began. The TITLE statement uses double rather than single quotation marks so that the macro variable resolves.
title "Sales Figures for Smith on &sysdate"; run;
Output
This is the output from the first PROC REPORT step, which creates the report definition.
Sales Figures for Smith on 04JAN02 1 Sector=Southeast Manager=Smith Department=Paper Sales= .00 Sector=Southeast Manager=Smith Department=Meat/Dairy Sales= 0.00 Sector=Southeast Manager=Smith Department=Canned Sales= 0.00 Sector=Southeast Manager=Smith Department=Produce Sales= .00
Program to Use a Report Definition
Set the SAS system options. The NODATE option suppresses the display of the date and time in the output. PAGENO= specifies the starting page number. FMTSEARCH= specifies the library to include when searching for user-created formats.
options nodate pageno=1 fmtsearch=(proclib);
Specify the report options, load the report definition, and select the observations to process. REPORT= uses the report definition that is stored in PROCLIB.REPORTS.NAMEWRAP to produce the report. The second report differs from the first one because it uses different WHERE and TITLE statements.
proc report data=grocery report=proclib.reports.namewrap nowd; where sector='sw'; title "Sales Figures for the Southwest Sector on &sysdate"; run;
Output
Sales Figures for the Southwest Sector on 04JAN02 1 Sector=Southwest Manager=Taylor Department=Paper Sector=Southwest Manager=Taylor Department=Meat/Dairy Sector=Southwest Manager=Taylor Department=Canned Sector=Southwest Manager=Taylor Department=Produce Sector=Southwest Manager=Adams Department=Paper Sector=Southwest Manager=Adams Department=Meat/Dairy Sector=Southwest Manager=Adams Department=Canned Sector=Southwest Manager=Adams Department=Produce
Sales Figures for the Southwest Sector on 04JAN02 2 Sales= .00 Sales= 0.00 Sales= 0.00 Sales= .00 Sales= .00 Sales= 0.00 Sales= 5.00 Sales= .00
Example 8: Condensing a Report into Multiple Panels
Procedure features:
-
PROC REPORT statement options:
-
FORMCHAR=
-
HEADLINE
-
LS=
-
PANELS=
-
PS=
-
PSPACE=
-
-
BREAK statement options:
-
SKIP
-
Other features:
-
SAS system option FORMCHAR=
Data set: GROCERY on page 963
Formats: $MGRFMT. and $DEPTFMT. on page 963
The report in this example
-
uses panels to condense a two-page report to one page. Panels compactly present
-
information for long, narrow reports by placing multiple rows of information side by side.
-
uses a default summary to place a blank line after the last row for each manager.
-
changes the default underlining character for the duration of this PROC REPORT step.
Program
Declare the PROCLIB library. The PROCLIB library is used to store user-created formats.
libname proclib ' SAS-data-library ';
Set the SAS system options. The NODATE option suppresses the display of the date and time in the output. PAGENO= specifies the starting page number. LINESIZE= specifies the output line length, and PAGESIZE= specifies the number of lines on an output page. FMTSEARCH= specifies the library to include when searching for user-created formats.
options nodate pageno=1 linesize=80 pagesize=60 fmtsearch=(proclib);
Specify the report options. The NOWD option runs PROC REPORT without the REPORT window and sends its output to the open output destination(s). HEADLINE underlines all column headings and the spaces between them at the top of each panel of the report. FORMCHAR= sets the value of the second formatting character (the one that HEADLINE uses) to the tilde (~). Therefore, the tilde underlines the column headings in the output. HEADSKIP writes a blank line beneath the underlining that HEADLINE writes. LS= sets the line size for the report to 64, and PS= sets the page size to 18. PANELS= creates a multipanel report. Specifying PANELS=99 ensures that PROC REPORT fits as many panels as possible on one page. PSPACE=6 places six spaces between panels.
proc report data=grocery nowd headline formchar(2)='~' panels=99 pspace=6 ls=64 ps=18;
Specify the report columns. The report contains a column for Manager, Department, and Sales.
column manager department sales;
Define the sort order and analysis columns. The values of all variables with the ORDER option in the DEFINE statement determine the order of the rows in the report. In this report, PROC REPORT arranges the rows first by the value of Manager (because it is the first variable in the COLUMN statement) and then, within each value of Manager, by the values of Department. The ORDER= option specifies the sort order for a variable. This report arranges the values of Manager by their formatted values and arranges the values of Department by their internal values (np1, np2, p1, and p2). FORMAT= specifies the formats to use in the report.
define manager / order order=formatted format=$mgrfmt.; define department / order order=internal format=$deptfmt.; define sales / format=dollar7.2;
Produce a report summary. This BREAK statement produces a default summary after the last row for each manager. Because SKIP is the only option in the BREAK statement, each break consists of only a blank line.
break after manager / skip;
Select the observations to process. The WHERE statement selects for the report only the observations for stores in the northwest or southwest sector.
where sector='nw' or sector='sw';
Specify the title.
title 'Sales for the Western Sectors'; run;
Output
Sales for the Western Sectors 1 Manager Department Sales Manager Department Sales ~~~~~~~~~~~~~~~~~~~~~~~~~~~~ ~~~~~~~~~~~~~~~~~~~~~~~~~~~~ Adams Paper .00 Canned 5.00 Reveiz Paper .00 Meat/Dairy 0.00 Canned 0.00 Produce .00 Meat/Dairy 0.00 Produce .00 Brown Paper .00 Canned 0.00 Taylor Paper .00 Meat/Dairy 0.00 Canned 0.00 Produce .00 Meat/Dairy 0.00 Produce .00 Pelfrey Paper .00 Canned 0.00 Meat/Dairy 5.00 Produce .00
Example 9: Writing a Customized Summary on Each Page
Procedure features:
-
BREAK statement options:
-
OL
-
PAGE
-
SUMMARIZE
-
-
COMPUTE statement arguments:
-
with a computed variable as report-item
-
BEFORE break-variable
-
AFTER break-variable with conditional logic
-
BEFORE _PAGE_
-
-
DEFINE statement options:
-
NOPRINT
-
-
LINE statement:
-
pointer controls
-
quoted text
-
repeating a character string
-
variable values and formats
-
Data set: GROCERY on page 963
Formats: $SCTRFMT., $MGRFMT., and $DEPTFMT. on page 963
The report in this example displays a record of one day's sales for each store. The rows are arranged so that all the information about one store is together, and the information for each store begins on a new page. Some variables appear in columns. Others appear only in the page header that identifies the sector and the store's manager.
The header that appears at the top of each page is created with the _PAGE_ argument in the COMPUTE statement.
Profit is a computed variable based on the value of Sales and Department.
The text that appears at the bottom of the page depends on the total of Sales for the store. Only the first two pages of the report appear here.
Program
Declare the PROCLIB library. The PROCLIB library is used to store user-created formats.
libname proclib ' SAS-data-library ';
Set the SAS system options. The NODATE option suppresses the display of the date and time in the output. PAGENO= specifies the starting page number. LINESIZE= specifies the output line length, and PAGESIZE= specifies the number of lines on an output page. FMTSEARCH= specifies the library to include when searching for user-created formats.
options nodate pageno=1 linesize=64 pagesize=30 fmtsearch=(proclib);
Specify the report options. The NOWD option runs PROC REPORT without the REPORT window and sends its output to the open output destination(s). NOHEADER in the PROC REPORT statement suppresses the default column headings.
proc report data=grocery nowd headline headskip;
Specify the title.
title 'Sales for Individual Stores';
Specify the report columns. The report contains a column for Sector, Manager, Department, Sales, and Profit, but the NOPRINT option suppresses the printing of the columns for Sector and Manager. The page heading (created later in the program) includes their values. To get these variable values into the page heading, Sector and Manager must be in the COLUMN statement.
column sector manager department sales Profit;
Define the group, computed, and analysis variables. In this report, Sector, Manager, and Department are group variables. Each detail row of the report consolidates the information for all observations with the same values of the group variables. Profit is a computed variable whose values are calculated in the next section of the program. FORMAT= specifies the formats to use in the report.
define sector / group noprint; define manager / group noprint; define profit / computed format=dollar11.2; define sales / analysis sum format=dollar11.2; define department / group format=$deptfmt.;
Calculate the computed variable. Profit is computed as a percentage of Sales. For nonperishable items, the profit is 40% of the sale price. For perishable items the profit is 25%. Notice that in the compute block you must reference the variable Sales with a compound name (Sales.sum) that identifies both the variable and the statistic that you calculate with it.
compute profit; if department='np1' or department='np2' then profit=0.4*sales.sum; else profit=0.25*sales.sum; endcomp;
Create a customized page header. This compute block executes at the top of each page, after PROC REPORT writes the title. It writes the page heading for the current manager s store. The LEFT option left-justifies the text in the LINE statements. Each LINE statement writes the text in quotation marks just as it appears in the statement. The first two LINE statements write a variable value with the format specified immediately after the variable s name.
compute before _page_ / left; line sector $sctrfmt. ' Sector'; line 'Store managed by ' manager $mgrfmt.; line ' '; line ' '; line ' '; endcomp;
Produce a report summary. This BREAK statement creates a default summary after the last row for each manager. OL writes a row of hyphens above the summary line. SUMMARIZE writes the value of Sales (the only analysis or computed variable) in the summary line. The PAGE option starts a new page after each default summary so that the page heading that is created in the preceding compute block always pertains to the correct manager.
break after manager / ol summarize page;
Produce a customized summary. This compute block places conditional text in a customized summary that appears after the last detail row for each manager.
compute after manager;
Specify the length of the customized summary text. The LENGTH statement assigns a length of 35 to the temporary variable TEXT. In this particular case, the LENGTH statement is unnecessary because the longest version appears in the first IF/THEN statement. However, using the LENGTH statement ensures that even if the order of the conditional statements changes, TEXT will be long enough to hold the longest version.
length text $ 35;
Specify the conditional logic for the customized summary text. You cannot use the LINE statement in conditional statements (IF-THEN, IF-THEN/ELSE, and SELECT) because it does not take effect until PROC REPORT has executed all other statements in the compute block. These IF-THEN/ELSE statements assign a value to TEXT based on the value of Sales.sum in the summary row. A LINE statement writes that variable, whatever its value happens to be.
if sales.sum lt 500 then text='Sales are below the target region.'; else if sales.sum ge 500 and sales.sum lt 1000 then text='Sales are in the target region.'; else if sales.sum ge 1000 then text='Sales exceeded goal!'; line ' '; line text .; endcomp; run;
Output
Sales for Individual Stores 1 Northeast Sector Store managed by Alomar Department Sales Profit ------------------------------------ Canned 0.00 8.00 Meat/Dairy 0.00 .50 Paper .00 .00 Produce .00 .50 ----------- ----------- 6.00 6.50 Sales are in the target region.
Sales for Individual Stores 2 Northeast Sector Store managed by Andrews Department Sales Profit ------------------------------------ Canned 0.00 8.00 Meat/Dairy 0.00 .00 Paper 0.00 .00 Produce 5.00 .25 ----------- ----------- ,045.00 1.25 Sales exceeded goal!
Example 10: Calculating Percentages
Procedure features:
-
COLUMN statement arguments:
-
PCTSUM
-
SUM
-
spanning headers
-
-
COMPUTE statement options:
-
CHAR
-
LENGTH=
-
-
DEFINE statement options:
-
COMPUTED
-
FLOW
-
WIDTH=
-
-
RBREAK statement options:
-
OL
-
SUMMARIZE
-
Other features:
-
TITLE statement
Data set: GROCERY on page 963
Formats: $MGRFMT. and $DEPTFMT. on page 963
The summary report in this example shows the total sales for each store and the percentage that these sales represent of sales for all stores. Each of these columns has its own header. A single header also spans all the columns. This header looks like a title, but it differs from a title because it would be stored in a report definition. You must submit a null TITLE statement whenever you use the report definition, or the report will contain both a title and the spanning header.
The report includes a computed character variable, COMMENT, that flags stores with an unusually high percentage of sales. The text of COMMENT wraps across multiple rows. It makes sense to compute COMMENT only for individual stores. Therefore, the compute block that does the calculation includes conditional code that prevents PROC REPORT from calculating COMMENT on the summary line.
Program
Declare the PROCLIB library. The PROCLIB library is used to store user-created formats.
libname proclib ' SAS-data-library ';
Set the SAS system options. The NODATE option suppresses the display of the date and time in the output. PAGENO= specifies the starting page number. LINESIZE= specifies the output line length, and PAGESIZE= specifies the number of lines on an output page. FMTSEARCH= specifies the library to include when searching for user-created formats.
options nodate pageno=1 linesize=64 pagesize=60 fmtsearch=(proclib);
Specify the report options. The NOWD option runs PROC REPORT without the REPORT window and sends its output to the open output destination(s). HEADLINE underlines all column headings and the spaces between them at the top of each page of the report. The null TITLE statement suppresses the title of the report.
proc report data=grocery nowd headline; title;
Specify the report columns. The COLUMN statement uses the text in quotation marks as a spanning heading. The heading spans all the columns in the report because they are all included in the pair of parentheses that contains the heading. The COLUMN statement associates two statistics with Sales: Sum and Pctsum. The Sum statistic sums the values of Sales for all observations that are included in a row of the report. The Pctsum statistic shows what percentage of Sales that sum is for all observations in the report.
column ('Individual Store Sales as a Percent of All Sales' sector manager sales,(sum pctsum) comment); Define the group and analysis columns. In this report, Sector and Manager are group variables. Each detail row represents a set of observations that have a unique combination of formatted values for all group variables. Sales is, by default, an analysis variable that is used to calculate the Sum statistic. However, because statistics are associated with Sales in the column statement, those statistics override the default. FORMAT= specifies the formats to use in the report. Text between quotation marks specifies the column heading.
define manager / group format=$mgrfmt.; define sector / group format=$sctrfmt.; define sales / format=dollar11.2 ''; define sum / format=dollar9.2 'Total Sales';
Define the percentage and computed columns. The DEFINE statement for Pctsum specifies a column heading, a format, and a column width of 8. The PERCENT. format presents the value of Pctsum as a percentage rather than a decimal. The DEFINE statement for COMMENT defines it as a computed variable and assigns it a column width of 20 and a blank column heading. The FLOW option wraps the text for COMMENT onto multiple lines if it exceeds the column width.
define pctsum / 'Percent of Sales' format=percent6. width=8; define comment / computed width=20 '' flow;
Calculate the computed variable. Options in the COMPUTE statement define COMMENT as a character variable with a length of 40.
compute comment / char length=40;
Specify the conditional logic for the computed variable. For every store where sales exceeded 15% of the sales for all stores, this compute block creates a comment that says Sales substantially above expectations . Of course, on the summary row for the report, the value of Pctsum is 100. However, it is inappropriate to flag this row as having exceptional sales. The automatic variable _BREAK_ distinguishes detail rows from summary rows. In a detail row, the value of _BREAK_ is blank. The THEN statement executes only on detail rows where the value of Pctsum exceeds 0.15.
if sales.pctsum gt .15 and _break_ = ' ' then comment='Sales substantially above expectations.'; else comment=' '; endcomp;
Produce the report summary. This RBREAK statement creates a default summary at the end of the report. OL writes a row of hyphens above the summary line. SUMMARIZE writes the values of Sales.sum and Sales.pctsum in the summary line.
rbreak after / ol summarize; run;
Output
1 Individual Store Sales as a Percent of All Sales Total Percent Sector Manager Sales of Sales ------------------------------------------------------------- Northeast Alomar 6.00 12% Andrews ,045.00 17% Sales substantially above expectations. Northwest Brown 8.00 9% Pelfrey 6.00 12% Reveiz ,110.00 18% Sales substantially above expectations. Southeast Jones 0.00 10% Smith 0.00 6% Southwest Adams 5.00 11% Taylor 3.00 6% --------- -------- ,313.00 100%
Example 11: How PROC REPORT Handles Missing Values
Procedure features:
-
PROC REPORT statement options:
-
MISSING
-
-
COLUMN statement
-
with the N statistic
-
Other features:
-
TITLE statement
Formats: $MGRFMT. on page 963
This example illustrates the difference between the way PROC REPORT handles missing values for group (or order or across) variables with and without the MISSING option. The differences in the reports are apparent if you compare the values of N for each row and compare the totals in the default summary at the end of the report.
Program with Data Set with No Missing Values
Declare the PROCLIB library. The PROCLIB library is used to store user-created formats.
libname proclib ' SAS-data-library ';
Set the SAS system options. The NODATE option suppresses the display of the date and time in the output. PAGENO= specifies the starting page number. LINESIZE= specifies the output line length, and PAGESIZE= specifies the number of lines on an output page. FMTSEARCH= specifies the library to include when searching for user-created formats.
options nodate pageno=1 linesize=64 pagesize=60 fmtsearch=(proclib);
Create the GROCMISS data set. GROCMISS is identical to GROCERY except that it contains some observations with missing values for Sector, Manager, or both.
data grocmiss; input Sector $ Manager $ Department $ Sales @@; datalines; se 1 np1 50 . 1 p1 100 se . np2 120 se 1 p2 80 se 2 np1 40 se 2 p1 300 se 2 np2 220 se 2 p2 70 nw 3 np1 60 nw 3 p1 600 . 3 np2 420 nw 3 p2 30 nw 4 np1 45 nw 4 p1 250 nw 4 np2 230 nw 4 p2 73 nw 9 np1 45 nw 9 p1 205 nw 9 np2 420 nw 9 p2 76 sw 5 np1 53 sw 5 p1 130 sw 5 np2 120 sw 5 p2 50 . . np1 40 sw 6 p1 350 sw 6 np2 225 sw 6 p2 80 ne 7 np1 90 ne . p1 190 ne 7 np2 420 ne 7 p2 86 ne 8 np1 200 ne 8 p1 300 ne 8 np2 420 ne 8 p2 125 ;
Specify the report options. The NOWD option runs PROC REPORT without the REPORT window and sends its output to the open output destination(s). HEADLINE underlines all column headings and the spaces between them.
proc report data=grocmiss nowd headline;
Specify the report columns. The report contains columns for Sector, Manager, the N statistic, and Sales.
column sector manager N sales;
Define the group and analysis variables. In this report, Sector and Manager are group variables. Sales is, by default, an analysis variable that is used to calculate the Sum statistic. Each detail row represents a set of observations that have a unique combination of formatted values for all group variables. The value of Sales in each detail row is the sum of Sales for all observations in the group. In this PROC REPORT step, the procedure does not include observations with a missing value for the group variable. FORMAT= specifies formats to use in the report.
define sector / group format=$sctrfmt.; define manager / group format=$mgrfmt.; define sales / format=dollar9.2;
Produce a report summary. This RBREAK statement creates a default summary at the end of the report. DOL writes a row of equal signs above the summary line. SUMMARIZE writes the values of N and Sales.sum in the summary line.
rbreak after / dol summarize;
Specify the title.
title 'Summary Report for All Sectors and Managers'; run;
Output with No Missing Values
Summary Report for All Sectors and Managers 1 Sector Manager N Sales ---------------------------------------- Northeast Alomar 3 6.00 Andrews 4 ,045.00 Northwest Brown 4 8.00 Pelfrey 4 6.00 Reveiz 3 0.00 Southeast Jones 4 0.00 Smith 2 0.00 Southwest Adams 3 5.00 Taylor 4 3.00 ========= ========= 31 ,443.00
Program with Data Set with Missing Values
Include the missing values. The MISSING option in the second PROC REPORT step includes the observations with missing values for the group variable.
proc report data=grocmiss nowd headline missing; column sector manager N sales; define sector / group format=$sctrfmt.; define manager / group format=$mgrfmt.; define sales / format=dollar9.2; rbreak after / dol summarize; run;
Output with Missing Values
Summary Report for All Sectors and Managers 2 Sector Manager N Sales ---------------------------------------- 1 .00 Reveiz 1 0.00 Smith 1 0.00 Northeast 1 0.00 Alomar 3 6.00 Andrews 4 ,045.00 Northwest Brown 4 8.00 Pelfrey 4 6.00 Reveiz 3 0.00 Southeast 1 0.00 Jones 4 0.00 Smith 2 0.00 Southwest Adams 3 5.00 Taylor 4 3.00 ========= ========= 36 ,313.00
Example 12: Creating and Processing an Output Data Set
Procedure features:
-
PROC REPORT statement options:
-
BOX
-
OUT=
-
-
DEFINE statement options:
-
ANALYSIS
-
GROUP
-
NOPRINT
-
SUM
-
Other features:
-
Data set options:
-
WHERE=
-
Data set: GROCERY on page 963
Formats: $MGRFMT. on page 963
This example uses WHERE processing as it builds an output data set. This technique enables you to do WHERE processing after you have consolidated multiple observations into a single row.
The first PROC REPORT step creates a report (which it does not display) in which each row represents all the observations from the input data set for a single manager. The second PROC REPORT step builds a report from the output data set. This report uses line-drawing characters to separate the rows and columns.
Program to Create Output Data Set
Declare the PROCLIB library. The PROCLIB library is used to store user-created formats.
libname proclib ' SAS-data-library ';
Set the SAS system options. The NODATE option suppresses the display of the date and time in the output. PAGENO= specifies the starting page number. LINESIZE= specifies the output line length, and PAGESIZE= specifies the number of lines on an output page. FMTSEARCH= specifies the library to include when searching for user-created formats.
options nodate pageno=1 linesize=64 pagesize=60 fmtsearch=(proclib);
Specify the report options and columns. The NOWD option runs PROC REPORT without the REPORT window and sends its output to the open output destination(s). OUT= creates the output data set TEMP. The output data set contains a variable for each column in the report (Manager and Sales) as well as for the variable _BREAK_, which is not used in this example. Each observation in the data set represents a row of the report. Because Manager is a group variable and Sales is an analysis variable that is used to calculate the Sum statistic, each row in the report (and therefore each observation in the output data set) represents multiple observations from the input data set. In particular, each value of Sales in the output data set is the total of all values of Sales for that manager. The WHERE= data set option in the OUT= option filters those rows as PROC REPORT creates the output data set. Only those observations with sales that exceed $1,000 become observations in the output data set.
proc report data=grocery nowd out=temp(where=(sales gt 1000)); column manager sales;
Define the group and analysis variables. Because the definitions of all report items in this report include the NOPRINT option, PROC REPORT does not print a report. However, the PROC REPORT step does execute and create an output data set.
define manager / group noprint; define sales / analysis sum noprint; run;
Output Showing the Output Data Set
This is the output data set that PROC REPORT creates. It is used as the input set in the second PROC REPORT step.
The Data Set TEMP 1 Manager Sales _____________BREAK______________ 3 1110 8 1045
Program That Uses the Output Data Set
Specify the report options and columns, define the group and analysis columns, and specify the titles. DATA= specifies the output data set from the first PROC REPORT step as the input data set for this report. The BOX option draws an outline around the output, separates the column headings from the body of the report, and separates rows and columns of data. The TITLE statements specify a title for the report.
proc report data=temp box nowd; column manager sales; define manager / group format=$mgrfmt.; define sales / analysis sum format=dollar11.2; title 'Managers with Daily Sales'; title2 'of over'; title3 'One Thousand Dollars'; run;
Report Based on the Output Data Set
Managers with Daily Sales 1 of over One Thousand Dollars ---------------------- Manager Sales -------------------- Andrews ,045.00 -------+------------ Reveiz ,110.00 ----------------------
Example 13: Storing Computed Variables as Part of a Data Set
Procedure features:
-
PROC REPORT statement options:
-
OUT=
-
-
COMPUTE statement:
-
with a computed variable as report-item
-
-
DEFINE statement options:
-
COMPUTED
-
Other features: CHART procedure
Data set: GROCERY on page 963
Formats: $SCTRFMT. on page 963
The report in this example
-
creates a computed variable
-
stores it in an output data set
-
uses that data set to create a chart based on the computed variable.
Program That Creates the Output Data Set
Declare the PROCLIB library. The PROCLIB library is used to store user-created formats.
libname proclib ' SAS-data-library ';
Set the SAS system options. The NODATE option suppresses the display of the date and time in the output. PAGENO= specifies the starting page number. LINESIZE= specifies the output line length, and PAGESIZE= specifies the number of lines on an output page. FMTSEARCH= specifies the library to include when searching for user-created formats.
options nodate pageno=1 linesize=64 pagesize=60 fmtsearch=(proclib);
Delete any existing titles.
title;
Specify the report options. The NOWD option runs PROC REPORT without the REPORT window and sends its output to the open output destination(s). OUT= creates the output data set PROFIT.
proc report data=grocery nowd out=profit;
Specify the report columns. The report contains columns for Manager, Department, Sales, and Profit, which is not in the input data set. Because the purpose of this report is to generate an output data set to use in another procedure, the report layout simply uses the default usage for all the data set variables to list all the observations. DEFINE statements for the data set variables are unnecessary.
column sector manager department sales Profit;
Define the computed column. The COMPUTED option tells PROC REPORT that Profit is defined in a compute block somewhere in the PROC REPORT step.
define profit / computed;
Calculate the computed column. Profit is computed as a percentage of Sales. For nonperishable items, the profit is 40% of the sale price. For perishable items the profit is 25%. Notice that in the compute block, you must reference the variable Sales with a compound name (Sales.sum) that identifies both the variable and the statistic that you calculate with it.
/* Compute values for Profit. */ compute profit; if department='np1' or department='np2' then profit=0.4*sales.sum; else profit=0.25*sales.sum; endcomp; run;
The Output Data Set
This is the output data set that is created by PROC REPORT. It is used as input for PROC CHART.
The Data Set PROFIT 1 Sector Manager Department Sales Profit _BREAK__ se 1 np1 50 20 se 1 p1 100 25 se 1 np2 120 48 se 1 p2 80 20 se 2 np1 40 16 se 2 p1 300 75 se 2 np2 220 88 se 2 p2 70 17.5 nw 3 np1 60 24 nw 3 p1 600 150 nw 3 np2 420 168 nw 3 p2 30 7.5 nw 4 np1 45 18 nw 4 p1 250 62.5 nw 4 np2 230 92 nw 4 p2 73 18.25 nw 9 np1 45 18 nw 9 p1 205 51.25 nw 9 np2 420 168 nw 9 p2 76 19 sw 5 np1 53 21.2 sw 5 p1 130 32.5 sw 5 np2 120 48 sw 5 p2 50 12.5 sw 6 np1 40 16 sw 6 p1 350 87.5 sw 6 np2 225 90 sw 6 p2 80 20 ne 7 np1 90 36 ne 7 p1 190 47.5 ne 7 np2 420 168 ne 7 p2 86 21.5 ne 8 np1 200 80 ne 8 p1 300 75 ne 8 np2 420 168 ne 8 p2 125 31.25
Program That Uses the Output Data Set
Set the SAS system options. The NODATE option suppresses the display of the date and time in the output. PAGENO= specifies the starting page number. LINESIZE= specifies the output line length, and PAGESIZE= specifies the number of lines on an output page. FMTSEARCH= specifies the library to include when searching for user-created formats.
options nodate pageno=1 linesize=80 pagesize=60 fmtsearch=(proclib);
Chart the data in the output data set. PROC CHART uses the output data set from the previous PROC REPORT step to chart the sum of Profit for each sector.
proc chart data=profit; block sector / sumvar=profit; format sector $sctrfmt.; format profit dollar7.2; title 'Sum of Profit by Sector'; run;
Output from Processing the Output Data Set
Sum of Profit by Sector 1 Sum of Profit by Sector ___ /_ / ___ ** /_ / ** ** ** ** ** ** ** ___ ___ -** --------** ---------/_ /---------/_ /------- / ** / ** / ** / ** / / ** / ** / ** / ** / / ** / ** / ** / ** / / **/ / **/ / **/ / **/ / / / / / / / 7.25 / 6.50 / 9.50 / 7.70 / /-------------/-------------/-------------/-------------/ Northeast Northwest Southeast Southwest Sector
Example 14: Using a Format to Create Groups
Procedure features:
-
DEFINE statement options:
-
GROUP
-
Other features: FORMAT procedure
Data set: GROCERY on page 963
Formats: $MGRFMT. on page 963
This example shows how to use formats to control the number of groups that PROC REPORT creates. The program creates a format for Department that classifies the four departments as one of two types: perishable or nonperishable. Consequently, when Department is an across variable, PROC REPORT creates only two columns instead of four. The column header is the formatted value of the variable.
Program
Declare the PROCLIB library. The PROCLIB library is used to store user-created formats.
libname proclib ' SAS-data-library ';
Set the SAS system options. The NODATE option suppresses the display of the date and time in the output. PAGENO= specifies the starting page number. LINESIZE= specifies the output line length, and PAGESIZE= specifies the number of lines on an output page. FMTSEARCH= specifies the library to include when searching for user-created formats.
options nodate pageno=1 linesize=64 pagesize=60 fmtsearch=(proclib);
Create the $PERISH. format. PROC FORMAT creates a format for Department. This variable has four different values in the data set, but the format has only two values.
proc format; value $perish 'p1','p2'='Perishable' 'np1','np2'='Nonperishable'; run;
Specify the report options. The NOWD option runs the REPORT procedure without the REPORT window and sends its output to the open output destination(s). HEADLINE underlines all column headings and the spaces between them at the top of each page of the report. HEADSKIP writes a blank line beneath the underlining that HEADLINE writes.
proc report data=grocery nowd headline headskip;
Specify the report columns. Department and Sales are separated by a comma in the COLUMN statement, so they collectively determine the contents of the column that they define. Because Sales is an analysis variable, its values fill the cells that are created by these two variables. The report also contains a column for Manager and a column for Sales by itself (which is the sales for all departments).
column manager department,sales sales;
Define the group and across variables. Manager is a group variable. Each detail row of the report consolidates the information for all observations with the same value of Manager. Department is an across variable. PROC REPORT creates a column and a column heading for each formatted value of Department. ORDER=FORMATTED arranges the values of Manager and Department alphabetically according to their formatted values. FORMAT= specifies the formats to use. The empty quotation marks in the definition of Department specify a blank column heading, so no heading spans all the departments. However, PROC REPORT uses the formatted values of Department to create a column heading for each individual department.
define manager / group order=formatted format=$mgrfmt.; define department / across order=formatted format=$perish. '';
Define the analysis variable. Sales is an analysis variable that is used to calculate the Sum statistic. Sales appears twice in the COLUMN statement, and the same definition applies to both occurrences. FORMAT= specifies the format to use in the report. WIDTH= specifies the width of the column. Notice that the column headings for the columns that both Department and Sales create are a combination of the heading for Department and the (default) heading for Sales.
define sales / analysis sum format=dollar9.2 width=13;
Produce a customized summary. This COMPUTE statement begins a compute block that produces a customized summary at the end of the report. The LINE statement places the quoted text and the value of Sales.sum (with the DOLLAR9.2 format) in the summary. An ENDCOMP statement must end the compute block.
compute after; line ' '; line 'Total sales for these stores were: ' sales.sum dollar9.2; endcomp;
Specify the title.
title 'Sales Summary for All Stores'; run;
Output
Sales Summary for All Stores 1 Nonperishable Perishable Manager Sales Sales Sales ---------------------------------------------------- Adams 5.00 0.00 5.00 Alomar 0.00 6.00 6.00 Andrews 0.00 5.00 ,045.00 Brown 5.00 3.00 8.00 Jones 0.00 0.00 0.00 Pelfrey 5.00 1.00 6.00 Reveiz 0.00 0.00 ,110.00 Smith 0.00 0.00 0.00 Taylor 3.00 0.00 3.00 Total sales for these stores were: ,313.00
Example 15: Specifying Style Elements for ODS Output in the PROC REPORT Statement
Procedure features: STYLE= option in the PROC REPORT statement
Other features:
-
ODS HTML statement
-
ODS PDF statement
-
ODS RTF statement
Data set: GROCERY on page 963
Formats: $MGRFMT. and $DEPTFMT. on page 963
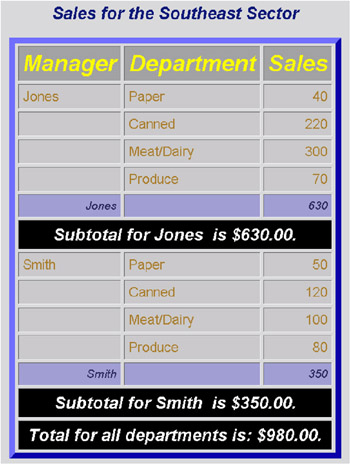
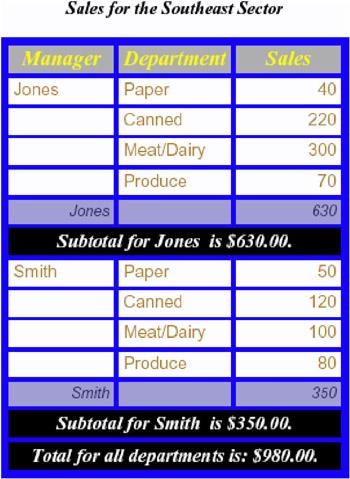
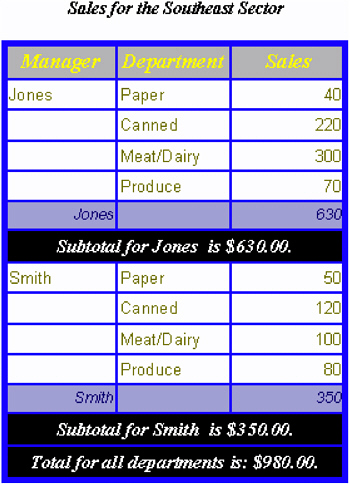
This example creates HTML, PDF, and RTF files and sets the style elements for each location in the report in the PROC REPORT statement.
Program
Declare the PROCLIB library. The PROCLIB library is used to store user-created formats.
libname proclib ' SAS-data-library ';
Set the SAS system options. The NODATE option suppresses the display of the date and time in the output. PAGENO= specifies the starting page number. FMTSEARCH= specifies the library to include when searching for user-created formats. LINESIZE= and PAGESIZE= are not set for this example because they have no effect on HTML, RTF, and Printer output.
options nodate pageno=1 fmtsearch=(proclib);
Specify the ODS output filenames. By opening multiple ODS destinations, you can produce multiple output files in a single execution. The ODS HTML statement produces output that is written in HTML. The ODS PDF statement produces output in Portable Document Format (PDF). The ODS RTF statement produces output in Rich Text Format (RTF). The output from PROC REPORT goes to each of these files.
ods html body=' external-HTML-file '; ods pdf file=' external-PDF-file '; ods rtf file=' external-RTF-file ';
Specify the report options. The NOWD option runs PROC REPORT without the REPORT window. In this case, SAS writes the output to the traditional procedure output, the HTML body file, and the RTF and PDF files.
proc report data=grocery nowd headline headskip
Specify the style attributes for the report. This STYLE= option sets the style element for the structural part of the report. Because no style element is specified, PROC REPORT uses all the style attributes of the default style element for this location except for CELLSPACING=, BORDERWIDTH=, and BORDERCOLOR=.
style(report)=[cellspacing=5 borderwidth=10 bordercolor=blue]
Specify the style attributes for the column headings. This STYLE= option sets the style element for all column headings. Because no style element is specified, PROC REPORT uses all the style attributes of the default style element for this location except for those that are specified here.
style(header)=[foreground=yellow font_style=italic font_size=6]
Specify the style attributes for the report columns. This STYLE= option sets the style element for all the cells in all the columns. Because no style element is specified, PROC REPORT uses all the style attributes of the default style element for this location except for those that are specified here.
style(column)=[foreground=moderate brown font_face=helvetica font_size=4]
Specify the style attributes for the compute block lines. This STYLE= option sets the style element for all the LINE statements in all compute blocks. Because no style element is specified, PROC REPORT uses all the style attributes of the default style element for this location except for those that are specified here.
style(lines)=[foreground=white background=black font_style=italic font_weight=bold font_size=5]
Specify the style attributes for report summaries. This STYLE= option sets the style element for all the default summary lines. Because no style element is specified, PROC REPORT uses all the style attributes of the default style element for this location except for those that are specified here.
style(summary)=[foreground=cx3e3d73 background=cxaeadd9 font_face=helvetica font_size=3 just=r];
Specify the report columns. The report contains columns for Manager, Department, and Sales.
column manager department sales;
Define the sort order variables. In this report Manager and Department are order variables. PROC REPORT arranges the rows first by the value of Manager (because it is the first variable in the COLUMN statement), then by the value of Department. For Manager, ORDER= specifies that values of Manager are arranged according to their formatted values; similarly, for Department, ORDER= specifies that values of Department are arranged according to their internal values. FORMAT= specifies the format to use for each variable. Text in quotation marks specifies the column headings.
define manager / order order=formatted format=$mgrfmt. 'Manager'; define department / order order=internal format=$deptfmt. 'Department';
Produce a report summary. The BREAK statement produces a default summary after the last row for each manager. SUMMARIZE writes the values of Sales (the only analysis or computed variable in the report) in the summary line. PROC REPORT sums the values of Sales for each manager because Sales is an analysis variable that is used to calculate the Sum statistic.
break after manager / summarize;
Produce a customized summary. The COMPUTE statement begins a compute block that produces a customized summary after each value of Manager. The LINE statement places the quoted text and the values of Manager and Sales.sum (with the formats $MGRFMT. and DOLLAR7.2) in the summary. An ENDCOMP statement must end the compute block.
compute after manager; line 'Subtotal for ' manager $mgrfmt. 'is ' sales.sum dollar7.2 '.'; endcomp;
Produce a customized end-of-report summary. This COMPUTE statement begins a compute block that executes at the end of the report. The LINE statement writes the quoted text and the value of Sales.sum (with the DOLLAR7.2 format). An ENDCOMP statement must end the compute block.
compute after; line 'Total for all departments is: ' sales.sum dollar7.2 '.'; endcomp;
Select the observations to process. The WHERE statement selects for the report only the observations for stores in the southeast sector.
where sector='se';
Specify the title.
title 'Sales for the Southeast Sector'; run;
Close the ODS destinations.
ods html close; ods pdf close; ods rtf close;
HTML Output
PDF Output
RTF Output
Example 16: Specifying Style Elements for ODS Output in Multiple Statements
Procedure features:
-
STYLE= option in
-
PROC REPORT statement
-
CALL DEFINE statement
-
COMPUTE statement
-
DEFINE statement
-
Other features:
-
ODS HTML statement
-
ODS PDF statement
-
ODS RTF statement
Data set: GROCERY on page 963
Formats: $MGRFMT. on page 963 and $DEPTFMT. on page 963
This example creates HTML, PDF, and RTF files and sets the style elements for each location in the report in the PROC REPORT statement. It then overrides some of these settings by specifying style elements in other statements.
Program
Declare the PROCLIB library. The PROCLIB library is used to store user-created formats.
libname proclib ' SAS-data-library ';
Set the SAS system options. The NODATE option suppresses the display of the date and time in the output. PAGENO= specifies the starting page number. FMTSEARCH= specifies the library to include when searching for user-created formats. LINESIZE= and PAGESIZE= are not set for this example because they have no effect on HTML, RTF, and Printer output.
options nodate pageno=1 fmtsearch=(proclib);
Specify the ODS output filenames. By opening multiple ODS destinations, you can produce multiple output files in a single execution. The ODS HTML statement produces output that is written in HTML. The ODS PDF statement produces output in Portable Document Format (PDF). The ODS RTF statement produces output in Rich Text Format (RTF). The output from PROC REPORT goes to each of these files.
ods html body=' external-HTML-file '; ods pdf file=' external-PDF-file '; ods rtf file=' external-RTF-file ';
Specify the report options. The NOWD option runs PROC REPORT without the REPORT window. In this case, SAS writes the output to the traditional procedure output, the HTML body file, and the RTF and PDF files.
proc report data=grocery nowd headline headskip
Specify the style attributes for the report. This STYLE= option sets the style element for the structural part of the report. Because no style element is specified, PROC REPORT uses all the style attributes of the default style element for this location except for those that are specified here.
style(report)=[cellspacing=5 borderwidth=10 bordercolor=blue]
Specify the style attributes for the column headings. This STYLE= option sets the style element for all column headings. Because no style element is specified, PROC REPORT uses all the style attributes of the default style element for this location except for those that are specified here.
style(header)=[foreground=yellow font_style=italic font_size=6]
Specify the style attributes for the report columns. This STYLE= option sets the style element for all the cells in all the columns. Because no style element is specified, PROC REPORT uses all the style attributes of the default style element for this location except for those that are specified here.
style(column)=[foreground=moderate brown font_face=helvetica font_size=4]
Specify the style attributes for the compute block lines. This STYLE= option sets the style element for all the LINE statements in all compute blocks. Because no style element is specified, PROC REPORT uses all the style attributes of the default style element for this location except for those that are specified here.
style(lines)=[foreground=white background=black font_style=italic font_weight=bold font_size=5]
Specify the style attributes for the report summaries. This STYLE= option sets the style element for all the default summary lines. Because no style element is specified, PROC REPORT uses all the style attributes of the default style element for this location except for those that are specified here.
style(summary)=[foreground=cx3e3d73 background=cxaeadd9 font_face=helvetica font_size=3 just=r];
Specify the report columns. The report contains columns for Manager, Department, and Sales.
column manager department sales;
Define the first sort order variable. In this report Manager is an order variable. PROC REPORT arranges the rows first by the value of Manager (because it is the first variable in the COLUMN statement). ORDER= specifies that values of Manager are arranged according to their formatted values. FORMAT= specifies the format to use for this variable. Text in quotation marks specifies the column headings.
define manager / order order=formatted format=$mgrfmt. 'Manager'
Specify the style attributes for the first sort order variable column heading. The STYLE= option sets the foreground and background colors of the column heading for Manager. The other style attributes for the column heading will match those that were established for the HEADER location in the PROC REPORT statement.
style(header)=[foreground=white background=black];
Define the second sort order variable. In this report Department is an order variable. PROC REPORT arranges the rows first by the value of Manager (because it is the first variable in the COLUMN statement), then by the value of Department. ORDER= specifies that values of Department are arranged according to their internal values. FORMAT= specifies the format to use for this variable. Text in quotation marks specifies the column heading.
define department / order order=internal format=$deptfmt. 'Department'
Specify the style attributes for the second sort order variable column. The STYLE= option sets the font of the cells in the column Department to italic. The other style attributes for the cells will match those that were established for the COLUMN location in the PROC REPORT statement.
style(column)=[font_style=italic];
Produce a report summary. The BREAK statement produces a default summary after the last row for each manager. SUMMARIZE writes the values of Sales (the only analysis or computed variable in the report) in the summary line. PROC REPORT sums the values of Sales for each manager because Sales is an analysis variable that is used to calculate the Sum statistic.
break after manager / summarize;
Produce a customized summary. The COMPUTE statement begins a compute block that produces a customized summary at the end of the report. This STYLE= option specifies the style element to use for the text that is created by the LINE statement in this compute block. This style element switches the foreground and background colors that were specified for the LINES location in the PROC REPORT statement. It also changes the font style, the font weight, and the font size.
compute after manager / style=[font_style=roman font_size=3 font_weight=bold background=white foreground=black];
Specify the text for the customized summary. The LINE statement places the quoted text and the values of Manager and Sales.sum (with the formats $MGRFMT. and DOLLAR7.2) in the summary. An ENDCOMP statement must end the compute block.
line 'Subtotal for ' manager $mgrfmt. 'is ' sales.sum dollar7.2 '.'; endcomp;
Produce a customized background for the analysis column. This compute block specifies a background color and a bold font for all cells in the Sales column that contain values of 100 or greater and that are not summary lines.
compute sales; if sales.sum>100 and _break_=' ' then call define(_col_, "style", "style=[background=yellow font_face=helvetica font_weight=bold]"); endcomp;
Produce a customized end-of-report summary. This COMPUTE statement begins a compute block that executes at the end of the report. The LINE statement writes the quoted text and the value of Sales.sum (with the DOLLAR7.2 format). An ENDCOMP statement must end the compute block.
compute after; line 'Total for all departments is: ' sales.sum dollar7.2 '.'; endcomp;
Select the observations to process. The WHERE statement selects for the report only the observations for stores in the southeast sector.
where sector='se';
Specify the title.
title 'Sales for the Southeast Sector'; run;
Close the ODS destinations.
ods html close; ods pdf close; ods rtf close;
HTML Body File
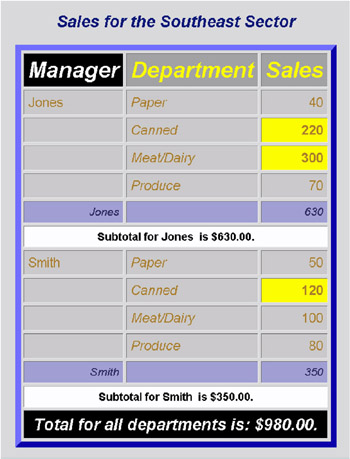
PDF Output
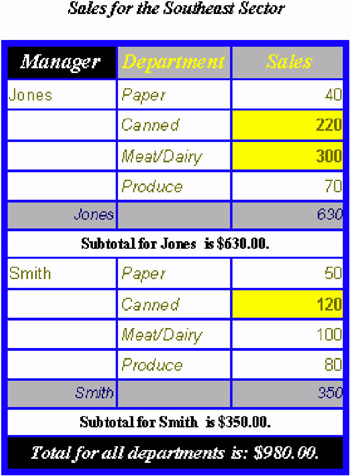
RTF Output
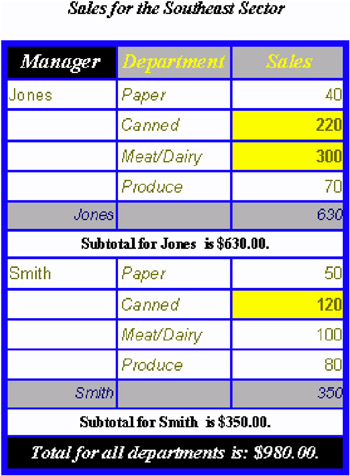
EAN: 2147483647
Pages: 260