Design Corner: Using Chart Formatting Options


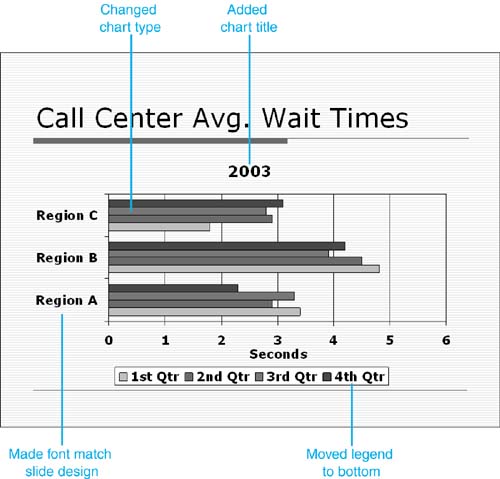
PowerPoint, in combination with Microsoft Graph, offers numerous chart-formatting options to help you create visually appealing charts . This example shows how even minor changes can enhance your chart.

For example, you could create a basic column chart by choosing the Title and Chart layout from the Slide Layout task pane (see the "Before" figure). To liven up the chart (see the "After" figure), follow these steps using the techniques you learned in this chapter:

  1. With your chart active, choose Chart, Chart Options to open the Chart Options dialog box.

  2. On the Titles tab, enter a title for your chart.

  3. On the Legend tab, place your legend on the bottom.

  4. Click the down arrow to the right of the Chart Type button on the Standard toolbar to display a palette of options.

  5. Click the Bar Chart button to change to a bar chart format (pause the mouse pointer over the buttons to identify the right button).

  6. For each chart object that has text, select it and set the font to match the font used in the slide design.

In only a couple of minutes, you enlivened your chart and made its format better suit your needs.

Before


Figure 11.30.

graphics/11fig30.gif


After


Figure 11.31.

graphics/11fig31.jpg


Special Edition Using Microsoft Office PowerPoint 2003
ISBN: 0789729571
EAN: 2147483647
Year: 2003
Pages: 261

flylib.com © 2008-2017.
If you may any questions please contact us: flylib@qtcs.net