| Various components of the Windows kernel and several core device drivers are instrumented to record trace data of their operation for use in system troubleshooting. They rely on a common infrastructure in the kernel that provides trace data to the user-mode Event Tracing for Windows (ETW) facility. An application that uses ETW falls into one or more of three categories: Controller A controller starts and stops logging sessions and manages buffer pools. Provider A provider defines GUIDs (globally unique identifiers) for the event classes it can produce traces for and registers them with ETW. The provider accepts commands from a controller for starting and stopping traces of the event classes for which it's responsible. Consumer A consumer selects one or more trace sessions for which it wants to read trace data. They can receive the events in buffers in real-time or in log files.
Windows Server systems include several built-in providers in user mode, including ones for Active Directory, Kerberos, and Netlogon. ETW defines a logging session with the name NT Kernel Logger (also known as the kernel logger) for use by the kernel and core drivers. The provider for the NT Kernel Logger is implemented by the Windows Management Instrumentation (WMI) device driver (driver name Wmixwdm), which is part of Ntoskrnl.exe. (See the WMI section in Chapter 5 for more information on WMI.) Besides serving as the core of the kernel logger, the driver manages user-mode ETW event class registration. The WMI driver exports I/O control interfaces for use by the ETW routines in user mode and the device drivers that provide traces data for the kernel logger. (See Chapter 9 for more information on I/O control commands.) It also implements functions for use by the components in Ntoskrnl.exe kernel mode that produce trace output. When a controller in user mode enables the kernel logger, the ETW library, which is implemented in \Windows\System32\Ntdll.dll, sends an I/O control request to the WMI driver telling it which event classes the controller wants to start tracing. If file logging is configured (as opposed to in-memory logging to a buffer), the WMI driver creates a system thread in the system process that creates a log file. When the WMI driver receives trace events from the enabled trace sources, it records them to a buffer. If it was started, the file logging thread wakes up once per second to dump the contents of the buffers to the log file. Trace records generated for the kernel logger have a standard ETW trace event header, which records timestamp, process, and thread IDs, as well as information on what class of event the record corresponds to. Event classes can provide additional data specific to their events. For example, disk event class trace records indicate the operation type (read or write), disk number at which the operation is directed, and sector offset and length of the operation. The trace classes that can be enabled for the kernel logger and the component that generates each class include: Disk I/O Disk class driver File I/O File system drivers Hardware Configuration Plug and play manager (See Chapter 9 for information on the Plug and Play Manager.) Image Load/Unload The system image loader in the kernel Page Faults Memory manager (See Chapter 7 for more information on page faults.) Process Create/Delete Process manager (See Chapter 6 for more information on the process manager.) Thread Create/Delete Process manager Registry Activity Configuration manager (See "The Registry" section in Chapter 4 for more information on the configuration manager.) TCP/UDP Activity TCP/IP driver
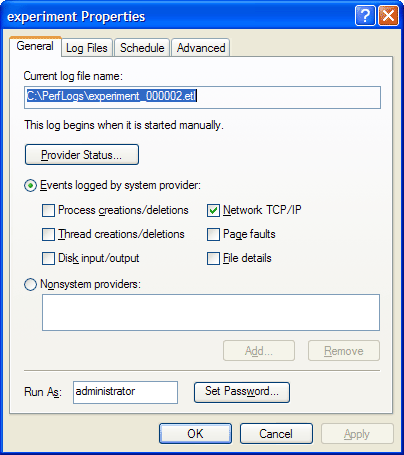
You can find more information on ETW and the kernel logger, including sample code for controllers and consumers, in the Platform SDK.  | EXPERIMENT: Tracing TCP/IP Activity with the Kernel LoggerTo enable the kernel logger and have it generate a log file of TCP/IP activity, follow these steps: Run the Performance Tool, and select the Performance Logs And Alerts node. Select Trace Logs, and then select New Log Settings from the Action menu. When prompted, enter a name for the settings (for example, experiment). On the dialog box that opens, select the Events Logged By System Provider option and then deselect everything except the Network TCP/IP option. In the Run As edit box, enter the Administrator account name and set the password to match it.
Dismiss the dialog box, and generate network activity by opening a browser and visiting a Web site. Select the trace log you created in the trace log node, and select Stop from the Action menu. Open a command prompt, and change to the C:\Perflogs directory (or the directory into which you specified that the trace log file be stored). If you are running Windows XP or Windows Server 20003, run Tracerpt (located in the \Windows\System32 directory) and pass it the name of the trace log file. If you are running Windows 2000, download and run Tracedmp from the Windows 2000 Resource Kit. Both tools generate two files: dumpfile.csv and summary.txt. Open dumpfile.csv in Microsoft Excel or in a text editor. You should see TCP and/ or UDP trace records like the following:
TcpIp | Recv | 0xFFFFFFFF | 1.27E+17 | 0 | 0 | 4 | 88 | 192.168.001.101 | 192.168.001.108 | 4608 | 0 | 0 | 0 | TcpIp | Send | 0xFFFFFFFF | 1.27E+17 | 0 | 0 | 4 | 76 | 192.168.001.101 | 192.168.001.108 | 4608 | 0 | 0 | 0 | TcpIp | Recv | 0xFFFFFFFF | 1.27E+17 | 0 | 0 | 4 | 88 | 192.168.001.101 | 192.168.001.108 | 4608 | 0 | 0 | 0 | TcpIp | Send | 0xFFFFFFFF | 1.27E+17 | 0 | 0 | 4 | 76 | 192.168.001.101 | 192.168.001.108 | 4608 | 0 | 0 | 0 | TcpIp | Recv | 0xFFFFFFFF | 1.27E+17 | 0 | 0 | 4 | 88 | 192.168.001.101 | 192.168.001.108 | 4608 | 0 | 0 | 0 | TcpIp | Send | 0xFFFFFFFF | 1.27E+17 | 0 | 0 | 4 | 76 | 192.168.001.101 | 192.168.001.108 | 4608 | 0 | 0 | 0 | TcpIp | Recv | 0xFFFFFFFF | 1.27E+17 | 0 | 0 | 4 | 88 | 192.168.001.101 | 192.168.001.108 | 4608 | 0 | 0 | 0 | TcpIp | Send | 0xFFFFFFFF | 1.27E+17 | 0 | 0 | 4 | 76 | 192.168.001.101 | 192.168.001.108 | 4608 | 0 | 0 | 0 |
|
|
|