Adjusting Curves
Curves are Photoshop s most powerful color adjustment tool. Whereas levels give you the ability to change three to nine points of adjustment, curves enable you to map many more. You can adjust an image s brightness curve to lighten or darken an image, improve its contrast, or even create wild solarization affects.
When you choose Image ’ Adjustments ’ Curves, Photoshop displays the Curves dialog box (see Figure 16.19). By default, the graph is divided into 16 squares, each representing 16 brightness levels. Press your Option/Alt key and click the graph to refine the grid into 100 squares, representing the total 256 brightness levels for finer adjustment.
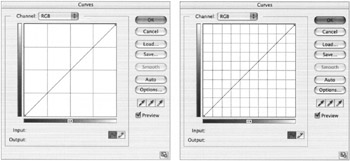
Figure 16.19: The default Curves dialog box shows a 16-cell graph (left); Option/Alt-clicking the grid changes it to a 100- cell graph (right).
You can expand the curves dialog box to make the graph bigger, which enables you to be more precise when you adjust the curve. Place your curser on the size icon in the lower right of the dialog box and drag down and to the right.
| Note | For more precision, click the Expand button in the lower-right corner to enlarge the dialog box. |
The horizontal axis of the graph represents the input levels, or the colors of the image before the adjustment. The vertical axis represents the output levels, or the color of the image after it has been adjusted. By default, for RGB images, dark colors are represented by the lower-left corner of the graph, and light colors are represented by the upper-right corner. The diagonal line from bottom-left to top-right represents the brightness levels of the image. Adjustments are made to the image by changing the shape of this line.
Figure 16.20 illustrates the power of curves. The unaltered photograph (a) is perhaps slightly underexposed in the shadows. If you click the center of the diagonal line in the Curves dialog box and drag it toward the upper-left , you will lighten the image, as in (b). If you bend it toward the lower-right, you will darken it (c). If you perform either of these operations, you alter the position of the midtones.
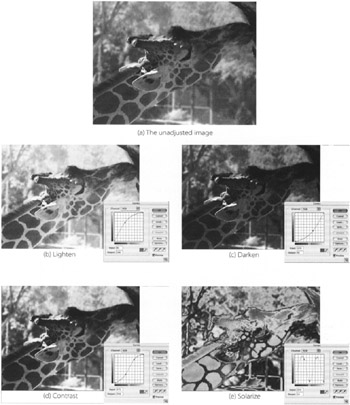
Figure 16.20: Examples of curve adjustments
A classic S curve, as shown in (d), will increase the contrast of the image by darkening the shadows and lightening the highlights. A roller -coaster curve (e) pushes the pixel values all over the graph and creates wild solarization effects.
Using the Brightness Bar
The horizontal brightness bar below the graph represents the direction of the values of the graph. By default, for RGB images, the light values are on the right and the dark values are on the left, but they can be switched easily by clicking the center arrows. If you reverse the graph, the light values will switch to the bottom and left, and the dark values to the top and right. If you are working on an RGB or Lab image and you switch the direction of the brightness bar, the numeric input and output values change from a measurement of channel information to ink coverage. This can be useful if you are planning to convert your image to CMYK.
The default Curves dialog box for a CMYK image is reversed from the RGB or Lab image. The brightness bars display dark values on the top and light values on the bottom. The input and output values are the percentage of ink coverage.
Choosing Graph Tools
Choose a graph tool from the Curves dialog box to edit the brightness curve. The Point tool ![]() is selected by default. Click the curve to establish anchor points, which can then be moved by dragging them with your mouse. As you drag, you can see the changes to your image if the Preview box is checked.
is selected by default. Click the curve to establish anchor points, which can then be moved by dragging them with your mouse. As you drag, you can see the changes to your image if the Preview box is checked.
Choose the Pencil tool ![]() by clicking on its icon. Click and drag on the curve to draw freeform lines. It performs very much like the Pencil tool in the Tool palette. If you want to draw a straight line, click once, press Shift, and click elsewhere.
by clicking on its icon. Click and drag on the curve to draw freeform lines. It performs very much like the Pencil tool in the Tool palette. If you want to draw a straight line, click once, press Shift, and click elsewhere.
Changing Input and Output Values
When you move the cursor over the curve, the input and output values change to reflect its position relative to the horizontal and vertical axes of the graph. You can click a point on the curve and enter new values for that point in these boxes, which will result in the bending of the curve.
Adjusting Channels
If you perform a Curves adjustment on the composite channel, you affect all of its channels simultaneously . As with levels, you can work with more precision by adjusting the channels individually. To choose a specific channel in which to work, scroll through the Channel pop-up list in the Curves dialog box. You can also select a combination of channels by Shift-selecting them in the Channels palette before opening the Curves dialog box.
Making a Lock-Down Curve
It often helps to work with a lock-down curve so that other colors in the image are unaffected when you make an adjustment. A lock-down curve stabilizes the curve and prevents it from bending. The brightness values that are affected when manipulating the curve can then be better controlled. To make a lock-down curve, follow these steps:
-
Choose Image ’ Adjustments ’ Curves to open the Curves dialog box.
-
Press Option/Alt and click the grid to display the 100-cell grid.
-
Place your cursor on the diagonal line at the exact point where the horizontal and vertical grid lines intersect. Click your mouse.
-
Click each intersection point along the diagonal line (see Figure 16.21).
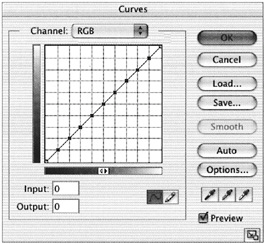
Figure 16.21: A lock-down curve -
Choose Red from the Channel pop-up list. Repeat step 4.
-
Repeat step 4 for the Green and Blue curves. This way, if you need to lock down a specific channel, the curve will be contained within the file.
-
Choose Save, and designate a location for your curve. Name the curve lockdown_curve .acv and save the file. You can now load the curve on any RGB document in any channel at any time. A file of the same name is provided in the h04 folder on your CD.
Determining the Position of a Color
You can pinpoint a color and determine its exact location on the curve. You can then place an anchor point and make a precise spot adjustment to that color only.
To determine the location of a color:
-
Open the file giraffe.psd in the h04 folder on the CD.
-
Choose Image ’ Adjustments ’ Curves to display the Curves dialog box.
-
Choose Load from the options on the right side of the dialog. Load lockdown_curve.acv you made in the previous section.
Note Use caution when using a lock-down curve. You might cause posterization (hard edged transitions between colors) if a large adjustment is applied to a small range of tones. In cases like this, Selective color or Hue/Saturation may produce better results.
-
Place your cursor on the large brown patch on the lower part of the giraffe s neck. Press Option/Alt and click the mouse. Observe the circle on the graph as you move your cursor. Press your
 /Ctrl key and click the mouse to place an anchor point.
 -
Place your cursor on the anchor point, click your mouse, and drag straight downward until the Output reads about 34 (see Figure 16.22). The targeted color on the giraffe intensifies because you ve increased its brightness value. All the other colors in the image, such as the background, are left at their original values because you locked them down.
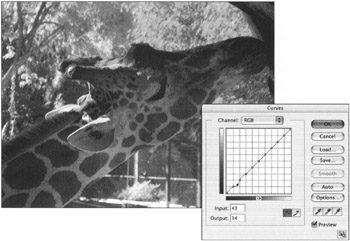
Figure 16.22: Adjusting the curve
Saving and Loading Curve Settings
As with levels, after you ve made a Curves adjustment to the image, you can save the settings and load them to another image:
-
Choose Save from the options on the right side of the Curves dialog box.
-
Choose a folder in which to save the setting, name it, and click OK.
-
To load the settings, choose Load from the options on the right side of the Curves dialog.
-
Locate the folder where the settings were saved and click Load to load the settings.
EAN: 2147483647
Pages: 355