Troubleshooting
 | |||||||||||
| Chapter 22 - Windows Services | |
| bySimon Robinsonet al. | |
| Wrox Press 2002 | |
Troubleshooting services is different from troubleshooting normal applications.
In this section, we will look at the following troubleshooting topics:
-
The problems of interactive services
-
Event logging
-
Performance monitoring
The best way to begin building a service is to create an assembly with the desired functionality and a test client, before the service is actually created. Here you can do normal debugging and error handling. As soon as the application is running you can build a service using this assembly. Of course, there still can be problems with the service:
-
Don't display errors in a message box from the service (except for interactive services that are running on the client system). Instead, use the event logging service to write errors to the event log. Of course, you can display a message box to inform the user about errors in the client application that uses the service.
-
The service can't be started from within a debugger, but a debugger can be attached to the running service process. Open the solution with the sourcecode of the service and set breakpoints. From the Visual Studio .NET Debug menu select Processes and attach the running process of the service.
-
The Windows 2000 Performance Monitor can be used to monitor the activity of services. We can add our own performance objects to the service. This can add some useful information for debugging. For example, with our service, we could set up an object to give the total number of quotes returned, the time it takes to initialize, and so on.
Interactive Services
If an interactive service runs with a logged-on user it can be helpful to display message boxes to the user. If the service should run on a server that would be locked inside a computer room, the service should never display a message box. When you open a message box, to wait for some user input, the user input probably won't happen for some days as nobody is looking at the server in the computer room; but it can get even worse than that - if the service isn't configured as an interactive service, the message box opens up on a different, hidden, window station. In this case, no one can answer that message box because it is hidden, and the service is blocked.
| Important | Never open dialogs for services running on a server system. Nobody will answer this dialog. |
In those cases where you really want to interact with the user, an interactive service can be configured. Some examples of such interactive services are the Print Spooler that displays paper-out messages to the user, and the NetMeeting Remote Desktop Sharing service.
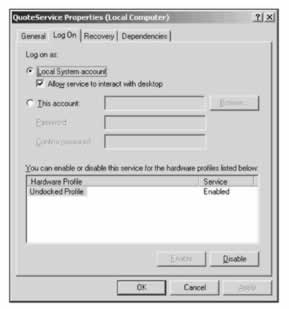
To configure an interactive service, the option Allow service to interact with desktop in the Services configuration tool must be set. This changes the type of the service by adding the SERVICE_INTERACTIVE_PROCESS flag to the type:
Event Logging
Services can report errors and other information by adding events to the event log. A service class derived from ServiceBase automatically logs events when the AutoLog property is set to true . The ServiceBase class checks this property and writes a log entry at start, stop, pause, and continue requests .
In this section, we will explore:
-
Error-logging architecture
-
Classes for event logging from the System.Diagnostics namespace
-
Adding event logging, to services and to other application types
-
Creating an event-log listener with the EnableRaisingEvents property of the EventLog class
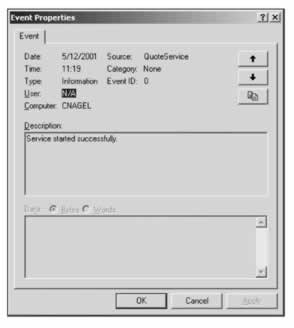
First, here's an example of a log entry from a service:
For custom event logging, we can use classes from the System.Diagnostics namespace.
Event Logging Architecture
By default, the Event Log is stored in three log files: Application, Security, and System. Looking at the Registry configuration of the event log service the three entries can be seen at HKEY_LOCAL_MACHINE\System\CurrentControlSet\Services\Eventlog with configurations pointing to the specific files. The System log file is used from the system and device drivers. Applications and services write to the Application log. The Security log is a read-only log for applications. The auditing feature of the operating system uses the Security log.
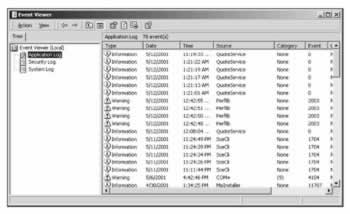
We can read these events using the administrative tool Event Viewer. The Event Viewer can be started directly from the Server Explorer of Visual Studio .NET by right-clicking on the Event Logs item, and selecting the Launch Event Viewer entry from the context menu:
In the Event log we can see this information:
-
The type can be Information , Warning , or Error . Information is an infrequent successful operation, Warning a problem that's not immediately significant, and Error a major problem. Additional types are FailureAudit and SuccessAudit , but these types are only used for the Security log.
-
Date and Time show the time when the event occurred.
-
The Source is the name of the software that logs the event. The source for the Application log is configured in:
HKEY_LOCAL_MACHINE\ System\CurrentControlSet\Services\ Eventlog\Application\[ApplicationName]
Below this key the value EventMessageFile is configured to point to a resource DLL that holds error messages.
-
A Category can be defined so that event logs can be filtered when using the Event Viewer. Categories can be defined by an event source.
-
The Event identifier specifies a particular event message.
Event Logging Classes
The System.Diagnostics namespace has some classes for event logging:
-
With the EventLog class we can read and write entries in the event log, and establish applications as event sources.
-
The EventLogEntry class represents a single entry in the event log. With the EventLogEntryCollection we can iterate through EventLogEntry items.
-
The EventLogInstaller class is the installer for an EventLog component. EventLogInstaller calls EventLog.CreateEventSource() to create an event source.
-
With the help of the EventLogTraceListener traces can be written to the event log. This class implements the abstract class TraceListener .
Adding Event Logging
If the AutoLog property of the ServiceBase class is set to true , event logging is automatically turned on. The ServiceBase class logs an informational event at startup, stop, pause, and continue requests of the service. In the ServiceInstaller class an EventLogInstaller instance is created so that an event log source is configured. This event log source has the same name as the service. If we want to write events we can use the static WriteEntry() method of the EventLog class. The Source property was already set in the ServiceBase class:
EventLog.WriteEntry ("event log message"); This method logs an informational event. If warning or error events should be created an overloaded method of WriteEvent() can be used to specify the type:
EventLog.WriteEntry("event log message", EventLogEntryType.Warning); EventLog.WriteEntry("event log message", EventLogEntryType.Error);
Adding Event Logging to Other Application Types
With services the ServiceBase class automatically adds event-logging features. If you would like to use event logging within other application types, this can easily be done using Visual Studio .NET.
-
Use the Toolbox to add an EventLog component to the designer.
-
Set the Log property of the EventLog component to Application and the Source property to a name you choose. This name is typically the name of the application that shows up in the Event Viewer.
-
Logs can now be written with the WriteEntry() method of the EventLog instance.
-
An installer can be added from the Add Installer context menu item of the EventLog component. This creates the ProjectInstaller class that configures the event source in the Registry.
-
The application can now be registered with the installutil command. installutil calls the ProjectInstaller class and registers the event source.
In the sense of xcopy -installation the last two steps are not really necessary. If the Source property of the EventLog instance is set, this source is automatically registered when an event log is written the first time. That's really easy to do, but for a real application I would prefer adding the installer: with installutil /u the event log configuration gets unregistered. If the application is just deleted, this Registry key remains unless EventLog.DeleteEventSource() is called.
Trace
It's also possible that all your trace messages are redirected to the event log. You shouldn't really do this, because on a normal running system the event log gets overblown with trace messages, and the System Administrator could miss the really important logs if this happens. Turning on trace messages to the event log can be a useful testing feature for problematic services. Tracing is possible with debug as well as with release code.
To send trace messages to the event log an EventLogTraceListener object must be created and added to the listener's list of the Trace class:
EventLogTraceListener listener = new EventLogTraceListener(eventLog1); Trace.Listeners.Add(listener);
Now, all trace messages are sent to the event log:
Trace.WriteLine("trace message"); Creating an Event Log Listener
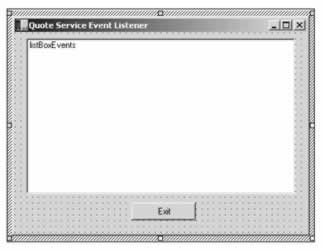
Now it would be useful if we could write an application that receives an event when a service encounters a problem. We will create a simple Windows application that monitors the events of our Quote service.
This Windows application has just a ListBox and an Exit button:
An EventLog component is added to this project by dragging and dropping it from the Toolbox . We set the Log property to Application , and the Source to the source of our service, QuoteService . The EventLog class also has a property, EnableRaisingEvents . Until now, we haven't talked about this property. The default value is false; setting it to true means that an event is generated each time this event occurs, and we can write an event handler for the EntryWritten Windows event.
In the file EventListener.cs of our project, the properties are set in InitializeComponent() :
private void InitializeComponent() { this.eventLogQuote = new System.Diagnostics.EventLog(); this.buttonExit = new System.Windows.Forms.Button(); this.listBoxEvents = new System.Windows.Forms.ListBox(); ((System.ComponentModel.ISupportInitialize) (this.eventLogQuote)).BeginInit(); this.SuspendLayout(); // // eventLogQuote // this.eventLogQuote.EnableRaisingEvents = true; this.eventLogQuote.Log = "Application"; this.eventLogQuote.Source = "QuoteService"; this.eventLogQuote.SynchronizingObject = this; this.eventLogQuote.EntryWritten += new System.Diagnostics.EntryWrittenEventHandler (this.OnEntryWritten); The OnEntryWritten() handler receives an EntryWrittenEventArgs object as argument, from which we can get the complete information about an event. With the Entry property we get an EventLogEntry object with information about the time, event source, type, category, and so on:
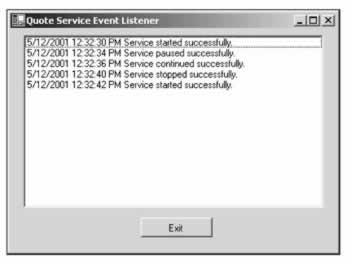
protected void OnEntryWritten (object sender, System.Diagnostics.EntryWrittenEventArgs e) { DateTime time = e.Entry.TimeGenerated; string message = e.Entry.Message; listBoxEvents.Items.Add(time + " " + message); }
The running application displays all events for the QuoteService :
Performance Monitoring
Performance monitoring can be used to get information about the normal running of the service. Performance monitoring is a great tool that helps us to understand the workload of the system, and to observe changes and trends.
Windows 2000 has a lot of performance objects, such as System , Memory , Objects , Process , Processor , Thread , Cache , and so on. Each of these objects has many counts to monitor. For example, with the Process object the user time, handle count, page faults, thread count, and so on, can be monitored for all processes, or for specific process instances. Some applications, such as SQL Server, also add application-specific objects.
For our quote service, we could be interested in getting the information about the number of client requests, how big the data is that is sent over the wire, and so on.
Performance Monitoring Classes
The System.Diagnostics namespace has these classes for performance monitoring:
-
PerformanceCounter can be used both to monitor counts and to write counts. New performance categories can also be created with this class.
-
With the PerformanceCounterCategory we can walk through all existing categories as well as create new ones. We can programmatically get all the counters of a category.
-
The PerformanceCounterInstaller class is used for the installation of performance counters. The use is similar to the EventLogInstaller we discussed previously.
Performance Counter Builder
We can create a new performance counter category by selecting the performance counters in the Server Explorer and selecting the menu entry Create New Category in the context menu. This starts the Performance Counter Builder:
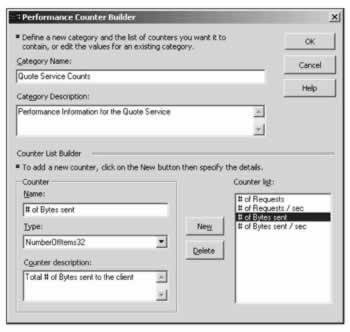
I'm setting the name of the category to be Quote Service . Here is a table showing all performance counters of our service:
| Name | Description | Type |
|---|---|---|
| # of Bytes sent | Total # of bytes sent to the client | NumberOfItems32 |
| # of Bytes sent / sec | # of bytes sent to the client in one second | RateOfCountsPerSecond32 |
| # of Requests | Total # of requests | NumberOfItems32 |
| # of Requests / sec | # of requests in one second | RateOfCountsPerSecond32 |
The Performance Counter Builder writes the configuration to the performance database. This can also be done dynamically using the Create() method of the PerformanceCounterCategory class in the System.Diagnostics namespace. An installer for other systems can easily be added later using Visual Studio .NET.
Adding Performance Counts
Next, we want to add the performance counts to the quote server. The QuoteService class has no knowledge about the information needed for the performance counts. We want to collect the number of requests, but after the start of the service QuoteService receives no requests. The information is completely contained in the QuoteServer class we built earlier.
Add Visual Studio .NET Designer Support to the Class Library
We could add instances of the PerformanceCounter class manually in the code, or we can use the Visual Studio .NET designer. With the Designer we can drag and drop PerformanceCounter components from the Toolbox. Designer support can be easily added to a component library by deriving the class from System.ComponentModel.Component . The method InitializeComponent() that will be used from the Designer to set the properties of the components will be added automatically as soon as the first component is dropped onto the Designer surface, but we do have to add a call to InitializeComponent() in the constructor. To remember the number of bytes sent and the request number we also add two private variables : requestPerSec and bytesPerSec .
public class QuoteServer : System.ComponentModel.Component { private TcpListener listener; private int port; private string filename; private StringCollection quotes; private Random random; private Thread listenerThread; private System.Diagnostics.EventLog eventLog; private int requestsPerSec; private int bytesPerSec; public QuoteServer(): this("quotes.txt") { } public QuoteServer(string filename) : this(filename, 7890) { } public QuoteServer(string filename, int port) { this.filename = filename; this.port = port; InitializeComponent(); }
Add PerformanceCounter Components
Now it's possible to add PerformanceCounter components from the Toolbox. For our service, we add four instances where the CategoryName property is set to " Quote Service Count " for all objects, and the CounterName property is set to one of the values available in the selected category. The ReadOnly property must be set to false .
The following code is generated into InitalizeComponent() by adding the PerformanceCounter components to the Designer and setting the properties as above:
private void InitializeComponent() { //... // // performanceCounterRequestsPerSec // this.performanceCounterRequestsPerSec.CategoryName = "Quote Service Counts"; this.performanceCounterRequestsPerSec.CounterName = "# of Requests / sec"; this.performanceCounterRequestsPerSec.ReadOnly = false; // // performanceCounterBytesSentTotal // this.performanceCounterBytesSentTotal.CategoryName = "Quote Service Counts"; this.performanceCounterBytesSentTotal.CounterName = "# of Bytes sent"; this.performanceCounterBytesSentTotal.ReadOnly = false; // // performanceCounterBytesSentPerSec // this.performanceCounterBytesSentPerSec.CategoryName = "Quote Service Counts"; this.performanceCounterBytesSentPerSec.CounterName = "# of Bytes sent / sec"; this.performanceCounterBytesSentPerSec.ReadOnly = false; // // performanceCounterRequestsTotal // this.performanceCounterRequestsTotal.CategoryName = "Quote Service Counts"; this.performanceCounterRequestsTotal.CounterName = "# of Requests"; this.performanceCounterRequestsTotal.ReadOnly = false; //...
The performance counts that show the total values are incremented directly in the Listener() method (shown below) of the QuoteServer class. We use PerformanceCounter.Increment() to count the number of total requests, and IncrementBy() to count the number of bytes sent.
For the performance counts that show the value by seconds, just two variables, requestsPerSec and bytesPerSec , are updated in the Listener() method:
protected void Listener() { try { listener = new TCPListener(port); listener.Start(); while (true) { Socket socket = listener.Accept(); string message = GetRandomQuoteOfTheDay(); UnicodeEncoding encoder = new UnicodeEncoding(); byte[] buffer = encoder.GetBytes(message); socket.Send(buffer, buffer.Length, 0); socket.Close(); performanceCounterRequestsTotal.Increment(); performanceCounterBytesSentTotal.IncrementBy(buffer.Length); requestsPerSec++; bytesPerSec += buffer.Length; } } catch (Exception e) { string message = "Quote Server failed in Listener: " + e.Message; eventLog.WriteEntry(message, EventLogEntryType.Error); } } To show updated values every second, we use a Timer component. The OnTimer() method gets called once per second and sets the performance counts using the RawValue property of the PerformanceCounter class:
protected void OnTimer (object sender, System.EventArgs e) { performanceCounterBytesSentPerSec.RawValue = bytesPerSec; performanceCounterRequestsPerSec.RawValue = requestsPerSec; bytesPerSec = 0; requestsPerSec = 0; }
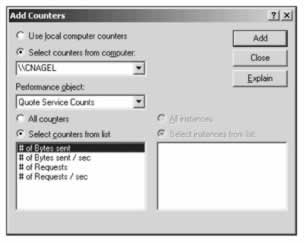
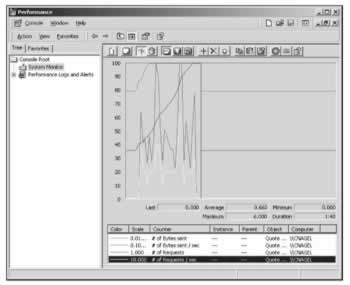
perfmon.exe
Now we can monitor our service. The Performance tool can be started from Administrative Tools Performance . Pressing the + button in the toolbar, we can add performance counts. The Quote Service shows up as a performance object. All the counters we configured show up in the counter list:
After the counts are added we can see the counts of our service over time. Using this performance tool, we can also create log files to analyze the performance at a later time:
EAN: 2147483647
Pages: 244