Section 10.7. User Research Sessions
10.7. User Research SessionsFace-to-face sessions involving one user at a time are a central part of the user research process. However, these sessions are also expensive and time-consuming. We've learned that you tend to get the most value out of these sessions by integrating two or more research methods. We typically combine an interview with either card sorting or user testing. This multimethod approach makes the most of your limited time with real users. 10.7.1. InterviewsWe often begin and end user research sessions with a series of questions. Starting with a brief Q&A can put the participant at ease. This is a good time to ask about her overall priorities and needs with respect to the site. Questions at the end of the session can be used to follow up on issues that came up during the user testing. This is a good time to ask what frustrates her about the current site and what suggestions she has for improvement. This final Q&A brings closure to the session. Here are some questions we've used for intranet projects in the past. Background
Information use
Intranet use
Document publishing
Suggestions
In determining what questions to ask, it's important to recognize that most users are not information architects. They don't have the understanding or vocabulary to engage in a technical dialogue about existing or potential information architectures. If you ask them if they like the current organization scheme or whether they think a thesaurus would improve the site's usability, you'll get blank stares or made-up answers. 10.7.2. Card SortingWant to get your hands on some of the most powerful information architecture research tools in the world? Grab a stack of index cards, some Post-it notes, and a pen. Card sorting may be low-tech, but it's great for understanding your users. What's involved? Not a whole lot, as you can see in Figure 10-8. Label a bunch of index cards with headings from categories, subcategories, and content within your web site. About 20 to 25 cards is usually sufficient. Number the cards so that you can more easily analyze the data later. Ask a user to sort this stack of cards into piles that make sense to him, and to label those piles using the Post-it notes. Ask him to think out loud while he works. Take good notes, and record the labels and contents of his piles. That's it! Figure 10-8. Sample index cards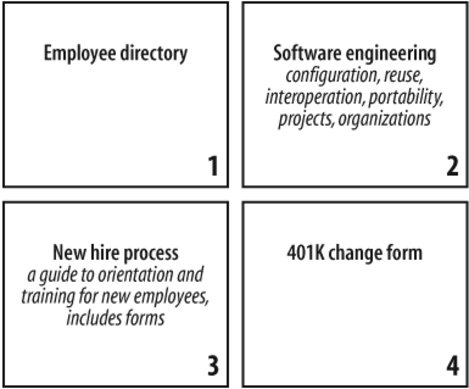 Card-sorting studies can provide insight into users' mental models, illuminating the ways they often tacitly group, sort, and label tasks and content in their own heads. The simplicity of this method confers tremendous flexibility. In the earliest phases of research, you can employ exploratory, open-ended card-sorting methods like the one we just described. Later on, you can use closed card sorts in which users rely on your predefined labels to question or validate a prototype information architecture. You can also instruct users to sort the cards according to what's most important to them; they can even have a pile for "things I don't care about." The permutations are infinite. Consider the following dimensions of card sorting:
Due to the popularity of this research method, several companies have developed software to support remote card sorting (see Figure 10-9 for an example), so you don't even need to be in the same room as the users! Did we mention this method is flexible? Figure 10-9. MindCanvas remote research software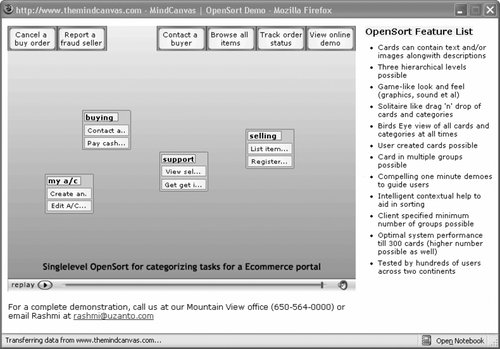 Just as there are many ways to do card sorting, there are many ways to analyze the results. From a qualitative perspective, you should be learning and forming ideas during the tests, as users talk out loud about their reasoning, their questions, and their frustrations. By asking follow-up questions, you can dig into some specifics and gain a better understanding of opportunities for organizing and labeling content. On the quantitative side, there are some obvious metrics to capture:
These metrics can be represented visually in an affinity modeling diagram (see Figure 10-10) to show the clusters and the relationships between clusters. You may want to plug your data into statistical analysis software and have it generate the visuals automatically. However, these automatically generated visualizations are often fairly complex and hard to understand. They tend to be better for identifying patterns than for communicating results. Figure 10-10. An automatically generated affinity model (prepared for Louis Rosenfeld and Michele de la Iglesia by Edward Vielmetti using InFlow 3.0 network analysis software from Valdis Krebs)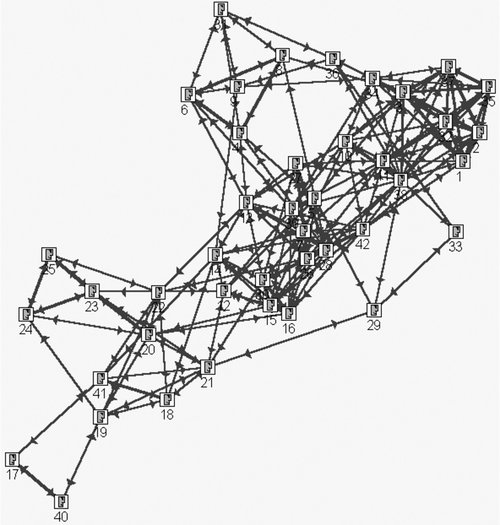 When you're ready to present research results to your clients, you may want to create a simpler affinity model by hand. These manually generated diagrams provide an opportunity to focus on a few highlights of the card-sorting results. In Figure 10-11, 80 percent of users grouped the "How to set DHTML event properties" card in the same pile as "Enterprise Edition: Deployment," suggesting they should be closely linked on the site. Note that "Load balancing web servers" is a boundary spanner and should probably be referenced in both categories on the site. Figure 10-11. A hand-crafted affinity model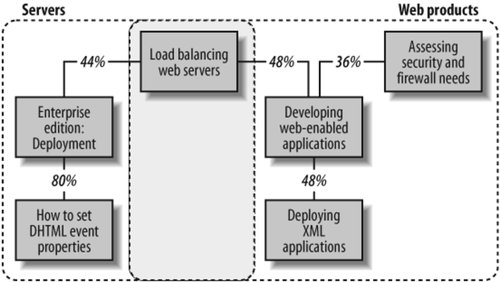 When used wisely, affinity models can inform the brainstorming process and are useful for presenting research results and defending strategic decisions. However, it's important to avoid masking qualitative research with quantitative analysis. If you conducted only five user tests, the numbers may not be statistically meaningful. So although card sorts produce very seductive data sets, we've found them most useful for the qualitatively derived insights they provide. 10.7.3. User TestingUser testing goes by many names, including usability engineering and information- needs analysis. Whatever you call it, user testing is fairly straightforward. As usability expert Steve Krug of Advanced Common Sense likes to say, "It's not rocket surgery." In basic user testing, you ask a user to sit in front of a computer, open a web browser, and try to find information or complete a task using the site you're studying. Allowing roughly three minutes per task, ask the user to talk out loud while he's navigating. Take good notes, making sure to capture what he says and where he goes. You may want to count clicks and bring a stopwatch to time each session. Once again, there are endless ways to structure this research. You may want to capture the session on audio or video, or use specialized software to track users' clickstreams. You might use the existing site, a high-fidelity web-based prototype, or even a low-fidelity paper prototype. You can ask the user to only browse or only search. Whenever possible, include a range of audience types. It's particularly important to mix people who are familiar and unfamiliar with the web site; experts and novices typically demonstrate very different behavior. Another important element is choosing the right tasks. These need to be clearly defined by your research agenda. If you're in an exploratory phase, consider distributing your tasks along the following lines:
As with content analysis, you'll also want to spread these tasks across multiple areas and levels of the web site. User testing typically provides a rich data set for analysis. You'll learn a great deal just by watching and listening. Obvious metrics include "number of clicks" and "time to find." These can be useful in before-and-after comparisons, hopefully to show how much you improved the site in your latest redesign. You'll also want to track common mistakes that lead users down the wrong paths. If you're a red-blooded information architect, you'll find these user tests highly energizing. There are few things more motivating to a user-sensitive professional than watching real people struggle and suffer with an existing site. You see the pain, you see what doesn't work, and you inevitably start creating all sorts of better solutions in your head. Don't ignore these great ideas. Don't convince yourself that creativity belongs only in the strategy phase. Strike while the iron's hot. Jot down the ideas during the research sessions, talk with your colleagues and clients between sessions, and expand on the ideas as soon as you get a spare minute. You'll find these notes and discussions hugely valuable as you move into the strategy phase. |
EAN: 2147483647
Pages: 194