Before You Begin
| Before we get into using WinDBG, I have to talk about getting everything installed and getting it properly configured. Even if you have experience with WinDBG, I suggest that you read this section to ensure that you have the best WinDBG setup possible. InstallationThose of you with .NET 2.0 installed already have the SOS extension DLL; it's part of the Framework installation. WinDBG and ADPlus are part of the Debugging Tools for Windows package, which is freely downloadable from http://www.microsoft.com/whdc/devtools/debugging/default.mspx. At the time I wrote this, I'm using version 6.6.7.5. When you download WinDBG, make sure to download the appropriate Win32 or Win64 flavor. As I mentioned back in the "Set Up a Source Server" section of Chapter 2, "Preparing for Debugging," to get the source server support, you'll need to install WinDBG with the custom options and include the SDK in the installation. Figure 6-1 shows the correct settings for a complete custom installation of the Debugging Tools for Windows. In addition to the source server support, the SDK includes all the documentation, headers, and libraries necessary to build your own WinDBG extensions to provide any advanced debugging support you could desire. You'll have to do so in native C++. If you're looking for an excellent article idea to start your writing career, you may want to consider writing WinDBG extensions that analyze the output of various SOS commands. Figure 6-1. SDK installation selected during the Debugging Tools for Windows installation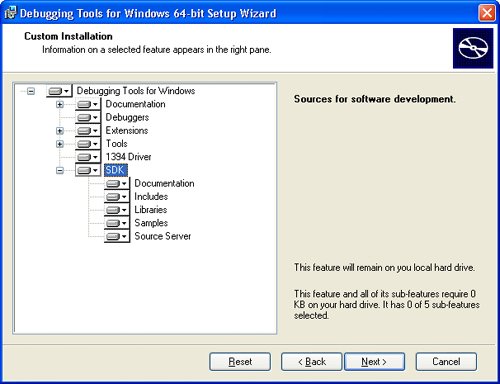 The Debugging Tools for Windows installation gives you far more than just WinDBG and ADPlus; you get numerous tools for assisting with native user mode and device driver debugging. Whereas I'm going to use WinDBG in this chapter, you may have a burning desire to see your SOS debugging inside a console-based application. The main reason for that is when you pull up a hard-core console-based tool, I can guarantee that you'll scare managers and weaker coworkers out of your office so you can get your work done. WinDBG is a simple GUI front end on top of a debugging engine, Dbgeng.dll, that does all the heavy lifting. If you want to use a console UI instead, use either NTSD.exe or CDB.exe console-based debuggers that are also installed as part of the Debugging Tools for Windows. The only difference between console-based debuggers is that CDB will use the existing console window for output, whereas NTSD will start a new console window. Everything I discuss in the WinDBG Command window works identically in NTSD.exe and CDB.exe. Some other tools of note that are also installed are Tlist.exe, which is a console application that reports the currently running processes with detailed information much as Mark Russinovich's Process Explorer discussed in Chapter 4, "Process Explorer." The Kill.exe program is a terminator program that will rip any type of user-mode process out of memory, even Windows Services, if you have the security permissions. As mentioned previously in this book, all the symbol-management tools are also part of the installation. You may want to poke around the installation directory because the WinDBG Team, as it is known inside Microsoft, is always dropping interesting tools in the Debugging Tools for Windows installation without ever mentioning them. Additional ReadingBefore you even think about starting WinDBG, you have to read the documentation in Debugger.chm in the Debugging Tools for Windows installation directory. I'll be covering WinDBG, SOS, and ADPlus solely from the standpoint of using them to handle .NET applications. Consequently, I won't be able to cover everything that the tools do. The Debugger Tools for Windows documentation is getting better with each release and is some of the best technical documentation I've seen from Microsoft. The first part you'll want to read is "Debuggers\Debugger Operation" to give you an overview of all the debugging tools. For all the information about symbol handling, read the "Debuggers\Symbols" section. You'll spend a lot of time in the "Debuggers\Debugger Reference" section because that goes into detail about all the commands and their options that you'll execute in the Command window. Finally, read the "Extra Tools\ADPlus" section. If you have the time, the more you read of the WinDBG documentation, the more alpha geeklike you'll become. By the way, if you look through the help file, you'll notice that there's zero documentation on SOS. The closest thing we have to documentation on SOS is the command help dump from the debugger extension itself. The good news is that help dump has gotten much better and is now usable. We no longer have to poke at the output and guess what we're looking at! You're probably wondering why, if the WinDBG documentation is so good, I even need to write this chapter. The weakness of the documentation is that it assumes that you have either a coworker sitting there showing you how to use WinDBG or have access to the internal Microsoft mailing lists where the debugger developers respond to questions. I don't think that's an intentional slight, but given that Microsoft developed WinDBG with the operating system developers primarily in mind, it's understandable. |
EAN: 2147483647
Pages: 99