Advanced Breakpoints for .NET Programs
|
In Chapter 5, you saw that the Visual Studio .NET debugger offers a fantastic amount of help for breaking exactly where you want. As for .NET code, there are some aspects of location breakpoint conditional expression modifiers I want to cover so that you fully understand the ramifications of using them.
Conditional Expressions
One of the most common questions I've been asked about conditional breakpoints over the years is this: "Can I call functions from the location breakpoint conditional expression modifier?" With native code debugging, you can't, but with .NET you certainly can. Calling functions or methods from conditional expressions opens up all sorts of excellent debugging capabilities, but as you can imagine, the side effects can make debugging almost impossible if you don't pay careful attention.
When I first started learning .NET, I didn't realize this extra power in conditional expressions existed because the functionality seemed natural. For example, I was using expressions such as MyString.Length == 7, thinking the debugger was reaching into the debuggee and getting the length value by reading memory directly just as it does in Win32 native debugging. After using an expression that called a more interesting property get accessor that did more work, I started experimenting to see everything I could do. Essentially, I figured out I could make any valid calls I wanted except to Web methods.
Probably the best way to show you the process of calling methods from conditional expressions is through an example. Listing 6-1 is a simple program, ConditionalBP (included with this book's sample code), which has a class, TestO, which keeps track of the number of times a method is called. If you set a conditional breakpoint on Console.WriteLine in Main with the expression (x.Toggle() == true) || (x.CondTest() == 0), you'll see that you'll only break when the m_bToggle field is true, and the m_CallCount field is an odd value. When the loop stops, you can inspect the value of the TestO instance in x and see that its fields are being changed, indicating the code is being called.
Listing 6-1: Conditional breakpoint modifier example
using System ; namespace ConditionalBP { class TestO { public TestO ( ) { m_CallCount = 0 ; m_bToggle = false ; } private Int32 m_CallCount ; public Int32 CondTest ( ) { m_CallCount++ ; return ( m_CallCount ) ; } private Boolean m_bToggle ; public Boolean Toggle ( ) { m_bToggle = !m_bToggle ; return ( m_bToggle ) ; } } class App { static void Main(string[] args) { TestO x = new TestO ( ) ; for ( Int32 i = 0 ; i < 10 ; i++ ) { // Set BP: (x.Toggle() == true) || (x.CondTest() == 0 ) Console.WriteLine ( "{0}" , i ) ; } x = null ; } } } Before you start slinging any property or method calls in your location breakpoint conditional expression modifiers, you should probably take a good look at what the property or method does. If it happens to copy a 3-GB database or otherwise changes state, you probably don't want to call it. What's also interesting about how the debugger evaluates the methods and properties you call is that the 20-second timeout that applies to the Watch window doesn't apply to calling methods from a conditional expression. If you have a method that happens to take days to evaluate, the debugger will merrily wait on the expression to finish. Fortunately, the Visual Studio .NET user interface (UI) isn't frozen, so pressing Ctrl+Alt+Break or selecting Break All from the Debug menu will immediately stop the debuggee.
This wonderful ability to call methods and properties from conditional breakpoints has one flaw in the Visual Studio .NET environment that I need to discuss. If you set a condition before you start debugging, the debugger will report that it can't evaluate the expression and will stop. However, if you set the condition incorrectly after you start debugging and the condition you set can't be evaluated or causes an exception to be thrown, the debugger won't stop. Once you've started debugging, if you set the condition incorrectly, you're completely out of luck.
With an invalid condition, the debugger will report that it couldn't set the breakpoint, as shown in Figure 6-1, but will continue to let the debuggee execute instead of stopping like you would expect. Nothing could be more frustrating than finally reproducing that one almost-impossible bug, only to have the debugger skip right over it. This was a bug in Visual Studio .NET 2002 and unfortunately is still a bug in Visual Studio .NET 2003. I certainly hope Microsoft fixes this problem in future versions of Visual Studio .NET so that when encountering the invalid condition, the debugger stops and lets you fix the problem condition.
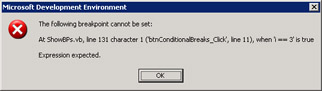
Figure 6-1: Visual Studio .NET indicating that it can't set a breakpoint
Because the breakpoint conditional expression modifier problem is so insidious, I want to show you a couple of examples where you can run into it. The first example shows how you have to be very careful of side effects from conditional expressions. In the following C# code, if you set a conditional breakpoint on the line that calls Console.WriteLine and you enter the condition as i = 3 (notice there's only one equal sign in the condition), what do you think happens? If you guessed that the condition changes the value of i and causes an infinite loop, you're correct. I can't emphasize enough that you need to be extremely careful when entering your expressions so that they are correct.
for ( Int32 i = 0 ; i < 10 ; i++ ) { Console.WriteLine ( "{0}" , i ) ; } In the second example, I have a Windows Forms application written in Microsoft Visual Basic .NET with the following simple method:
Private Sub btnSkipBreaks_Click(ByVal sender As System.Object, _ ByVal e As System.EventArgs) _ Handles btnSkipBreaks.Click Dim i As Integer ' Clear the output edit control. edtOutput.Clear() m_TotalSkipPresses += 1 edtOutput.Text = "Total presses: " + _ m_TotalSkipPresses.ToString() + _ vbCrLf For i = 1 To 10 ' Append each character to the output edit box. edtOutput.Text += i.ToString() + vbCrLf ' Force the output edit box to update on each iteration. edtOutput.Update() Next End Sub
If you happen to be thinking C# when entering a breakpoint inside the For loop and set the breakpoint conditional expression modifier to i==3 (the correct Visual Basic .NET expression would be i=3) because the program is running, you'll see a fine message box similar to the one in Figure 6-1. What's sad is that you'll see the edit control fill with all the text, indicating that the code continues to execute. For Windows Forms and console applications, you should always set conditional expressions before starting the debugger. That way, if any of the expressions are ill-formed, Visual Studio .NET will notify you and stop on the first line of the program, thus giving you a fighting chance to correct the problem. For Microsoft ASP.NET applications and XML Web services, there's nothing you can do to get an early chance to rectify breakpoint conditional expression modifier problems, so you have to take extra care when setting the expressions.
The third example of where you'll run into problems with conditional expression breakpoints is when the expression happens to cause an exception for any reason. You'll see the same basic message box as shown in Figure 6-1. The good news is that the exception won't bring the program down because the exception is never passed to your application, but you still won't be able to stop and fix the expression. When using variables in an expression, take extra care to ensure that the expression is correct.
On a final note about conditional breakpoints, remember that in C# and J#, you can use null, true, and false as part of the expression. Oddly, null didn't work in Visual Studio .NET 2002. In Visual Basic .NET, you can use True and False for Boolean comparisons. To compare a variable to Nothing, the Is operator works just fine (MyObject Is Nothing).
To set a per-thread breakpoint, you need a way to uniquely identify the thread. Fortunately for us, the Microsoft .NET Framework team was thinking ahead and provided the Name property on the System.Threading.Thread class to make identifying a thread a trivial task, so you can simply set a conditional expression breakpoint with something like "ThreadIWantToStopOn" == Thread.CurrentThread.Name. Of course, this is assuming you always set the Name property inside your code whenever you start a thread.
The first way to obtain a unique thread identifier is to manually set the thread name by changing the value of the Name property in the Watch window. If you have the MyThread instance variable, you can enter MyThread.Name and enter the new thread name in the Value column. If you don't have a thread variable, you can use Thread.CurrentThread.Name to set the current thread's name. Setting the thread name from the debugger assumes that you're not also setting it from your code. The Name property can be set only once, and if you attempt to set it again, you'll cause an InvalidOperationException. If you're working with your own code without many third-party controls, it's fairly safe to set the thread name from the debugger because the .NET Framework class library doesn't access the Name property.
However, if you're working with lots of-third party controls or with code you suspect might access the Name property, there's another technique for getting a unique thread identifier that, although not as readily identifiable at a glance like a thread name, still yields a unique value. Buried deep in the Thread class is a private integer variable, DONT_USE_InternalThread, that is unique to each thread. (Yes, you can access private variables inside conditional expressions.) To stop on a specific thread, you'll need to use the Threads window to maneuver to the thread you want to stop on. In the Watch window, enter Thread.CurrentThread.DONT_USE_InternalThread to see the value of DONT_USE_InternalThread so that you can create the appropriate conditional breakpoint expression. Keep in mind that any variable named DONT_USE_xxx might disappear in the future.
|
EAN: 2147483647
Pages: 177