LOG ANALYSIS SOFTWARE
Web server log files are a potential treasure trove of information — they provide websites with a profusion of raw data concerning visitors to the site. Historically, log files were used most for a quick overview of bandwidth problems and basic tracking information. But although these logs contain an instant, ongoing, fairly exact and specific snapshot of your website’s traffic patterns, they are somewhat difficult to read and to understand. This is where log analysis software is of help. Such software can take this raw data and tell you if pages are frequently or rarely visited. It analyzes how the data flows back and forth between your web server and your users, and gives information about IP traffic, e-commerce, cookies and browsers (vital if you’re using Java or Active X). Log analysis software crunches the data to show how well your website is working, the origin and number of visitors, where they are going and how they found you in the first place. In addition, a detailed click stream analysis tracks every single click a user makes on your website. Such data is essential for auditing a specific user’s activity. The more robust (and expensive) software can even offer historical and e-commerce reports reflecting time online and an authenticated user history.
The proper use of log analysis software data gives you valuable insight into how your website is being used. With some of the log analysis software available today, the easy-to-get-at statistics can be translated into slick graphs and bar charts for the non-technical crowd. However, unless taught otherwise, most website operators merely concentrate on figures such as the total of visitors to the site as a whole or to a particular page, and the number of banner click-throughs.
But log analysis software is also useful for finding problems with your site. For example you can track “error messages” that cause people to leave a site, if you see many of them in a day’s report, you know you have a problem. You might see an error message and realize that the message only occurs with a certain browser version. Another example is security. Chapter 7, which covers website security, offers some useful ways you can use log analysis software to monitor your site and to help find culprits after a nefarious attack.
Large web-based businesses have astute marketing and advertising departments that use the results for trend analysis and use the extensive user demographics that such logs contain (i.e. how are users using the site). If you add to that user-registration and a responsible use of cookies, then the collected data can be transformed into a powerful customer intelligence tool.
Traffic Reporting
The traffic report segment of your log analysis software provides data on how much user traffic your website attracts, who’s visiting the site, where the visitors are coming from, and how your web traffic changes on a hourly, daily, weekly, or monthly basis. A website traffic report is the simplest way to find out what works and what doesn’t work. It can provide you with the information necessary to determine which web pages are not selected or to show a page that is immensely popular. Such reports could be compiled from the web server logs but it wouldn’t be easy. In fact, without log analysis software it would be almost impossible to decipher details such as:
- The number of unique visitors to your site, when the came, from which countries, and from which referring sites (e.g. which search engine did they use to find your site)?
- What keywords did they use to find your website?
- Which pages did they access?
- How long did the visitor stay?
Understanding which outside sources generate page views can give you the opportunity to execute increasingly effective marketing strategies.
Usually your home page will be the #1 visited page on your site. By analyzing the traffic you can ascertain how your site design is succeeding. If you have a brochureware site, you’ll now be able to tell if your potential customers go to the target pages. If you run an advertising site, you can compare the traffic on the web pages with a lot of banners to a page with fewer banners. If you operate a subscription site, you’ll see what content is the most examined. If you have an online store, you’ll know which products are the most scrutinized by browsing customers. If the sales figures don’t reflect the same pattern, you now have a starting point to figure out why.
Conversely, if you find, via the traffic logs, that certain pages are less popular, analyze why. Traffic to an individual page may be influenced by your site design. Therefore, if it is the “About Us” page or “Investor Relations” page, don’t sweat it. But if it’s an important page that offers a new product or service, rethink the design. If traffic numbers to a specific area of your site disappoint you, look for possible reasons, such as technical problems. Perhaps you should provide a link on the home page or on a related content page. If you have an advertising site and you have a page that stands out as one that your visitors often use to exit your site, figure out why and fix it. Maybe there’s a banner on the page that that causes a slow load time or an ad that is particularly irritating. The logs may show that you have traffic on the page but visitors come, see, and leave. They don’t stay around and explore. Why?
After analyzing the traffic logs, doing your homework, and adjusting your website, wait a month or so and see if the changes helped. If not, try something else. It could be that your site is just fine but you need more public relations, advertising, or some other type of promotion such as a give-away. Again, after each little tweak, wait a month and analyze the logs. You’ll gradually find what works and what doesn’t.
Browsers and Operating Systems: Another aspect of log analysis software is that it can give you statistics on your customers’ browsers and operating systems. (This data is usually found in your server’s referer log files.) Take the lead from this data to ascertain if your customers use browsers sufficiently advanced so that you can add more bells and whistles to your site. If the majority of your customers are using the latest technology, you know you will lose little in traffic if you implement a Java application or a Flash plug-in.
How do Your Customers Find Your Site? This is important. You must know where your customers are coming from. Most should be referred to your website from search engines and directories. The second largest referrer should be from linked sites. Look at this data very carefully, if your top referrers are not Google or Yahoo!, find out why not. Is it something you can address? If so, do it. (Read Chapter 15, which discusses how to list your website with search engines and directories.)
Some log analysis software provide advanced reporting solutions such as monitoring web, ad, and streaming media servers, testing and checking broken links, and gauging page download times. This software also has the ability to monitor, to alert, and to recover server and network devices.
NOTE
So-called “packet sniffing” technology has been introduced into the traffic analysis market which eliminates the need to collect and centralize log file data. This technology gets its information directly from the TCP/IP packets that are sent to and from the web server.
The products available to help you analyze your website’s usage vary as widely as the information various businesses request. The “basics” might provide you with the information you need without the sticker shock, if you are willing to work with limited options and don’t mind that the presentation of data is “plain vanilla.” More advanced products offer a variety of in-depth features and give you many customization options, including great reports with color graphs and bars.
The cost of the Log Analysis Software begins at “free” for AXS 2.0 (www.xav.com/scripts/axs/). This product can help you analyze the visits to your web pages. AXS 2.0 determines where visitors are coming from, charts their flow through your site, and informs you as to which links they follow when leaving. Also, you can analyze other information such as the referrer (Google, Yahoo!, MSN, Alta Vista, etc.), IP addresses, types of web browser, and the dates and the times of each visit. AXS 2.0 then processes the records into meaningful graphs and database listings.
Two low-cost options:
3DStats (www.3dstats.com) works with all web servers that use the common log file format. With 3Dstats, you can create a 3D bar chart showing the daily number of total HTTP requests (hits), the number of files sent (documents actually transmitted on behalf of requests), the number of “304’s” (“Not Modified” responses caused by various caching mechanisms), and a number of other responses (redirections, not found responses, server errors).
Absolute Log Analyzer (www.bitstrike.com/analyzer) is a client-based log processing solution designed for web traffic analysis. This log analyzer product is easy to use and offers feature-rich tools that can generate fast, effective reports of any kind and display them in a format that’s easy to read and understand. There are three versions of Absolute Log Analyzer - Lite ($50), Standard ($150) and Professional ($250). All versions have compatible workspace and database format, although the Lite version contains less statistical capability and has less flexibility while the Professional incorporates all available log analysis options.
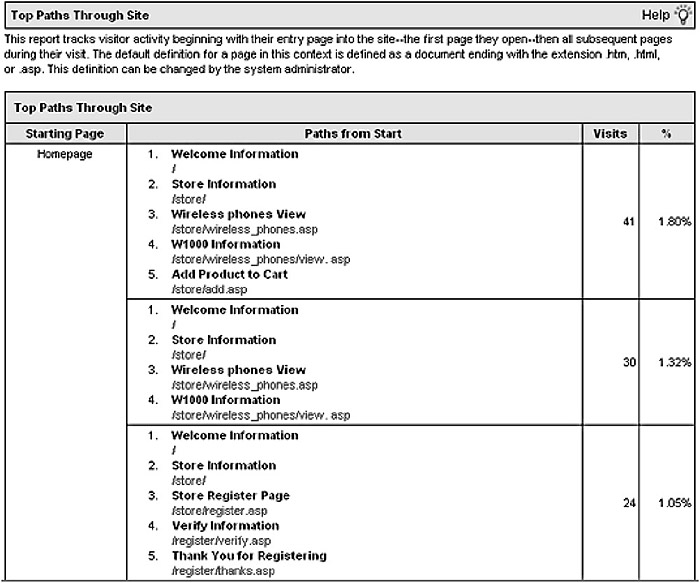
Figure 15: The WebTrends Log Analyzer’s Top Paths Through Site report depicted in this graphic delivers a click-by-click view of your website’s visitors’ behavior — from their point of entry into your site, through the subsequent pages they visit, to the exit. Graphic courtesy of WebTrends.
Here are a couple of more costly traffic analysis tools you might want to consider:
Webtrends Log Analyzer (www.netiq/webtrends), which costs around $500, provides an easy-to-use website analysis solution specifically designed for the small business.
Sane Solutions’s NetTracker Professional (www.sane.com/products/NetTracker/), which costs approximately $500, enables you to view the individual clickstream path of each visitor to your website, to analyze use of dynamically generated web content, and to measure site effectiveness of banner ad campaigns and response times and page delivery. The NetTracker Professional also measures site “stickiness” via repeat, new, and unique visitor behavior analysis.
Another option is a real-time monitoring and statistical reporting system such as WatchWise (www.watchwise.com). Each access to a registered website is automatically stored in real-time on the WatchWise server. It also monitors files that are downloaded from a registered website. Statistical reports are then generated in real-time, so you can determine who has downloaded your files. You can view these reports whenever you wish.
EAN: N/A
Pages: 159
- Challenging the Unpredictable: Changeable Order Management Systems
- The Effects of an Enterprise Resource Planning System (ERP) Implementation on Job Characteristics – A Study using the Hackman and Oldham Job Characteristics Model
- Context Management of ERP Processes in Virtual Communities
- Intrinsic and Contextual Data Quality: The Effect of Media and Personal Involvement
- Healthcare Information: From Administrative to Practice Databases