Displaying Execution Plans in Query Analyzer
| The Query Analyzer produces a graphical execution plan that provides analysis information in an intuitive and easy-to-view manner. You can display the execution plan in one of two ways. You can display an estimated execution plan for the entire contents of the Query Panel, or for any highlighted SQL code in the Query Panel, by choosing Display Estimated Execution Plan from the Query menu. You can also invoke it by using the Ctrl+L keyboard shortcut. This feature is useful for displaying and analyzing execution plans for long-running queries or queries with large result sets without having to wait for the results to be returned. You can also display the actual execution plans for queries as they are executed by selecting the Show Execution Plan option in the Query menu, or by using the Ctrl+K keyboard shortcut. This option is a toggle that remains on until you select it again to disable it. When this option is enabled, your query results will be displayed along with an Execution Plan tab in the results panel. Click on the Execution Plan tab to display the execution plan for the query or queries that are executed. This option is especially useful when you want to execute commands and compare the actual runtime and I/O statistics with the execution plan estimates. (These statistics can be displayed with the SET STATISTICS options described in the "Statistics" section later in this chapter.) The graphical execution plans display a series of nodes that are connected by lines. Each node is represented by an icon, which indicates the logical and physical operator executed for that node. The execution plan flows from right to left and top to bottom, eventually ending at a statement icon, which indicates the type of query that generated the execution plan. This query might be a SELECT , INSERT , UPDATE , TABCREATE , and so on. The arrows between the icons indicate the movement of rows between operators. If the query window contains multiple statements, multiple query execution plans are displayed in the execution plan panel. For each query in the batch that is analyzed and displayed, the relative cost of the query is displayed as a percentage of the total cost of the batch. To interpret and analyze the execution plan output, start with the farthest icon on the right, and read each ToolTip as you move left and down through the tree. Each icon in the query tree is called a node, and icons displayed under each other participate in the same level of the execution tree.
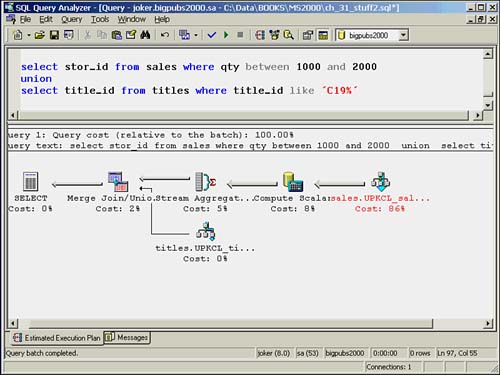
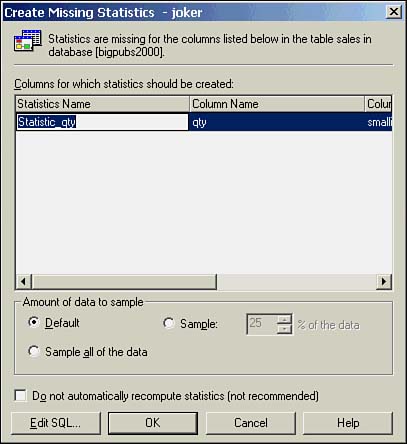
Figure 36.1 shows a sample Query Analyzer graphical execution plan window. Figure 36.1. Query Analyzer graphical execution plan. The Query Analyzer will indicate tables that are missing statistics by displaying the icon text in red in the graphical execution plan. You can create the missing statistics by right-clicking the icon and selecting the Create Missing Statistics option, which will bring up the dialog box displayed in Figure 36.2. Figure 36.2. The Create Missing Statistics dialog box that is invoked from the graphical query plan. Right-clicking on any icon in the tree presents the Manage Indexes and Manage Statistics options. These options invoke a dialog box from which you can create, edit, or drop indexes, or create, update, or drop statistics, respectively. If you right-click on a node that represents some form of access method on a table or index (table scan, index seek, and so on), the dialog box will come up with the specified table already selected. The remainder of this section describes the icons and information provided in the graphical execution plan. Analyzer ToolTipsWhen a graphical execution plan is presented in the Query Analyzer, you can get more information about each node in the execution plan by moving the mouse cursor over the icon. ToolTips for estimated execution plans are slightly different from the ToolTips displayed for an execution plan that is generated when the query is actually executed. The ToolTip that is displayed for an estimated execution plan will provide the following information:
The ToolTips for an execution plan that is generated when the query is actually executed display the same information as the estimated execution plan with two primary differences. The first difference is that the Number of executes displayed represents the actual number of times the operator was executed, rather than an estimate. The second difference is that in addition to the Estimated row count, the ToolTip also displays the actual number of rows (Row count) returned by the operation. This information is useful in determining the effectiveness of the statistics on the column or index by comparing how closely the estimated row count matches the actual row count. If a significant difference exists, (significant being a relative term ) then you might need to update the statistics and possibly increase the sample size used when the statistics are updated to generate more accurate statistics.
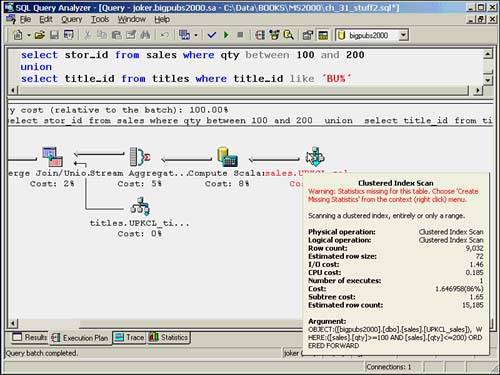
Figure 36.3 displays a sample ToolTip for one of the operators in an execution plan that is similar to the one shown in Figure 36.1. Notice the difference between the estimated row count (15,185) and the actual row count (9,032). This indicates an obvious issue with missing or out-of-date statistics. Figure 36.3. A ToolTip example. In this example, the ToolTip displays the information for a Clustered Index Scan physical operation. You will also notice that the lines flowing from this node are much wider than the lines from the other node, reflecting the greater estimated number of rows being returned by this operation (15,185 versus 4). The I/O cost and CPU cost provide critical information about the relative performance of this query. You want these numbers to be as low as possible. The Subtree cost will display cumulated costs for this node and any previous nodes that feed into it. This number increases as you move to the left. For the last icon, the statement icon, the ToolTip displays the total Subtree cost for the entire query, as well as the total Row count.
The Cost and Number of executes values provide helpful information about this particular part of the query operation. Merge joins make only one pass through both sets of input data, so the Number of executes for each input to a merge join should be 1. For nested loops, which are iterative, one of the inputs will typically have an estimated Number of Executes that is more than 1, usually equal to the estimated number of rows in the outer input to the nested loop. You can see this for this query by selecting the ToolTips for both of the inputs to a nested loops operation. The Argument section outlines the predicates and parameters that the query uses. In this case, you can see how the BETWEEN operator is being treated as an >= AND <= operation. This information is useful in determining how the optimizer is interpreting your search arguments (SARGs) and if they are being interpreted as optimizable SARGs. Putting all of the ToolTip information together provides the key to understanding each operation and its potential cost. You can use this information to compare various incarnations of a query to determine whether changes to the query result in improved query plans, and whether the estimated values are consistent with actual values. Logical and Physical Operator IconsTo better understand the graphical execution plans displayed, it helps to be able to recognize what each of the displayed icons represents. This is especially valuable so that you can quickly locate operations that appear out of place for the type of query being executed. The following sections cover the more common logical and physical operators displayed in the Query Analyzer execution plans.
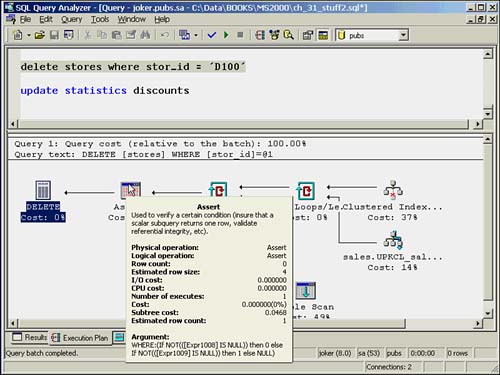
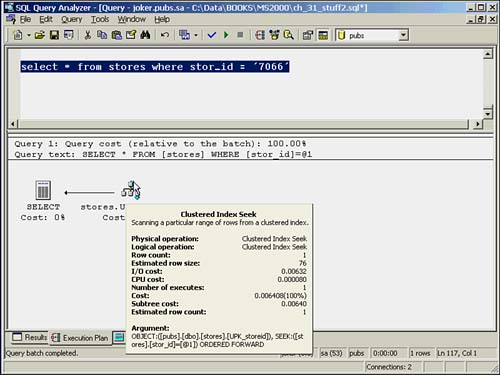
AssertAssert is used to verify a condition, such as an RI or check constraint. It sort of acts as a roadblock, allowing a result stream to continue only if the check being performed is satisfied. The argument that is displayed in the Assert ToolTip will spell out each check being performed. For example, a deletion from the stores table in the bigpubs2000 database has to be verified to ensure that it doesn't violate referential integrity with the discounts and sales tables. The reference constraint needs to check that the stor_id being deleted does not exist in the sales or discount table. If the result of the Assert returns a NULL, the stream continues through the query. Figure 36.4 shows the execution plan and ToolTip of the Assert that appears for a delete on stores. The argument indicates that the reference constraint rejects any case in which the matching foreign key expression that returns from both child tables is NOT NULL. Notice that it returns a different value (0 or 1) depending on which table the foreign key violation occurs so that the appropriate error message can be displayed. Figure 36.4. Assert example. Bookmark LookupThe Bookmark Lookup icon in the execution plan indicates that the query processor needed to look up the row in the table or clustered index. One example of when this can happen is when the nonclustered index being used for the operation needs to retrieve information from the data page. (In other words, the index doesn't cover the query.) This situation is an example of when the columns in the SELECT clause of the statement can influence the execution plan. The WITH PREFETCH clause indicates that the query optimizer will use asynchronous prefetch (read-ahead) on this lookup. Clustered Index or Index: Delete, Insert, and UpdateThe Clustered Index or Index physical operators Delete, Insert, and Update indicate that one or more rows in the specified clustered index or nonclustered index are being deleted, inserted, or updated. Clustered Index or Index: Scan and SeekSeek is a logical and physical operator that indicates the optimizer is using either a clustered or nonclustered index to find rows via the index pointers. An index scan (also a logical and physical operator) indicates whether the optimizer is scanning all or a subset of the table or index rows. Figure 36.5 shows a Clustered Index Seek ToolTip. The ToolTip indicates that the seek is being performed against the UPK_Storeid index on the stores table. The Argument section indicates that the seek is looking for the value in the parameter, and the optimizer determines that the results need to be output in clustered index order, as indicated by the ORDERED FORWARD keyword at the end of the Argument. Figure 36.5. Clustered Index Seek ToolTip example. Collapse and SplitA Split physical and logical operator indicates that the query optimizer has decided to break the rows input from the previous update optimization step into a separate delete and insert operation. The Estimated Row Count in the Split icon ToolTips will normally be double the input row count, reflecting this two-step operation. If possible, the optimizer might then choose later in the plan to collapse those rows, grouping by a key value. Compute ScalarThe optimizer uses the Computer Scalar operator to output a computed scalar value. This is a value that might be returned in the result set, or used as input to another operation in the query, such as a filter predicate. You might see this operator when data values that are feeding an input need to be converted to a different datatype first. ConcatenationThe Concatenation operator indicates that the result sets from two output sources are being concatenated . You often see this when a UNION ALL is being used. You can force a concatenation union strategy by using the OPTION clause in the query and specifying a CONCAT UNION . Optimization of Union queries with examples of the execution plan outputs is covered in Chapter 35. Constant ScanThe Constant Scan icon indicates that the optimizer is comparing against a constant value in the operation. A Compute Scalar operation often provides the input to the constant scan. Deleted Scan and Inserted ScanThe Deleted Scan and Inserted Scan icons in the execution plan indicate that a trigger is being fired and that within that trigger, the optimizer needs to scan either the deleted or inserted tables. FilterThe Filter icon indicates that the input rows are being filtered according to the argument that is indicated in the ToolTip. This seems to occur primarily for intermediate operations that the optimizer needs to perform. Hash Match, Hash Match Root, and Hash Match TeamHash joins are covered in more depth in Chapter 35, but to understand these three physical operators, you must understand the basic concept of hash joins to some degree. In a hash join, the keys that are common between the two tables are hashed into a hash bucket using the same hash function. This bucket will usually start out in memory and then move to disk as needed. The type of hashing that occurs depends on the amount of memory required. Hashing is commonly used for inner and outer joins, intersections, unions, and differences. The optimizer often uses hashing for intermediate processing. A hash join requires at least one equality clause in the predicate, which includes the clauses used to relate a primary key to a foreign key. Usually, the optimizer will select a hash join when the input tables are unsorted or are different in size, when no appropriate indexes exist, or when specific ordering of the result is not required. Hash joins help provide better query performance for large databases, complex queries, and distributed tables. A hash match uses the hash join strategy and might also include other criteria to be considered a match. The other criteria is indicated in the RESIDUAL clause shown in the Hash Match ToolTip. A hash match team is a group of operators that share a common hash function and strategy. The hash match root is the operator that coordinates the hash match team and is responsible for outputting the results to the next step in the process. Index Spool, Row Count Spool, and Table SpoolAn Index Spool, Row Count Spool, or Table Spool icon indicates that the rows are being stored in a temporary spooling table in the tempdb database. This is similar to the worktable that was created in SQL Server 6.5. Generally, this spool will be created to support a nested iteration operation because the optimizer might need to use the rows again. Often, you see a spool icon under a Nested Loops icon in the execution plan. A Table Spool ToolTip will not show a predicate because no index is used. An Index Spool ToolTip will show a SEEK predicate. A temporary worktable is created for an index spool, and then a temporary index is created on that table. These temporary worktables are local to the connection and live only as long as the query. Eager or Lazy SpoolThe optimizer will select to use either an Eager or Lazy method of filling the spool, depending on the query. The Eager method means that the spool table is built all at once upon the first request. The Lazy method builds the spool table as a row is requested . Log Row ScanThe Log Row Scan icon indicates that the transaction log is being scanned. Merge JoinThe merge join is a strategy requiring that both the inputs be sorted on the common columns, defined by the predicate. This allows one pass through each input table, matching the merge columns defined in the WHERE clause as it steps through each input. A merge join looks similar to a simple nested loop but occurs in only one pass. Occasionally, you might see an additional sort operation prior to the merge join operation when the initial inputs are not sorted properly. Nested LoopsNested loop joins are also known as nested iteration. Basically, in a nested iteration, every qualifying row in the outer table is compared to every qualifying row within the inner table. This is why you will often see a Spool icon of some sort providing input to a Nested Loop icon. This allows the inner table rows to be reused ”or "rewound." When every row in each table is being compared, it is called a naive nested loops join. If an index is used to find the qualifying rows, it is referred to as an index nested loops join. The number of comparisons for this method is the calculation of the number of outer rows times the number of inner rows. This can become expensive. Generally, a nested loops join is considered to be most effective when both input tables are small. ParallelismThe Parallelism icon indicates that parallel query processing is being performed. The associated logical operator displayed will be one of the Distribute Streams, Gather Streams, or Repartition Streams logical operations. Parallel query processing strategies are covered in more detail in Chapter 35. Parameter Table ScanThe Parameter Table Scan icon indicates that a table is acting as a parameter in the current query. Typically, this is displayed when INSERT queries exist within a stored procedure. Remote Delete, Remote Insert, Remote Query, Remote Scan, and Remote UpdateThe Remote Delete, Remote Query, Remote Scan, and Remote Update operators indicate that the operation is being performed against a remote server. SequenceThe Sequence operator executes each operation in its child node, moving from top to bottom in sequence, and returns only the end result from the bottom operator. You see this most often in the updates of multiple objects. SortThe Sort operator indicates that the input is being sorted. The sort order will be displayed in the ToolTip Argument section. Stream AggregateYou will most often see the Stream Aggregate operation when you are aggregating a single input, such as a distinct clause, or a sum , count , max , min , or avg operator. Table Delete, Table Insert, Table Scan, and Table UpdateYou will see the Table Delete, Table Insert, Table Scan, and Table Update operators when the indicated operation is being performed against that table as a whole. This does not always mean that a problem exists, although a table scan can be an indicator that you need some indexes to support the query. A table scan can still occur on small tables, especially when they are only a single page in size. A SELECT INTO statement that produces a Table Insert might also be an indication that you need a better indexing strategy. TopThe Top operator indicates a limit that is set, either by number of rows or a percentage, on the number of results to be returned from the input. The Argument column in the ToolTip might contain a list of the columns that are being checked for ties if the WITH TIES options has been specified. Analyzing Stored ProceduresLike other SQL statements, stored procedures are not executed when you choose to display the estimated execution plan in Query Analyzer. Because the stored procedures are not executed when displaying the estimated execution plan, any temporary tables that would be created within the stored procedure during execution will not actually be created. Because the tables are not created, any subsequent references to these tables in the stored procedure will generate an Invalid object name error message. This error prevents the estimated execution plan from being displayed for stored procedures that create and reference temporary tables. You will only be able to view actual execution plans for stored procedures that create and reference temporary tables.
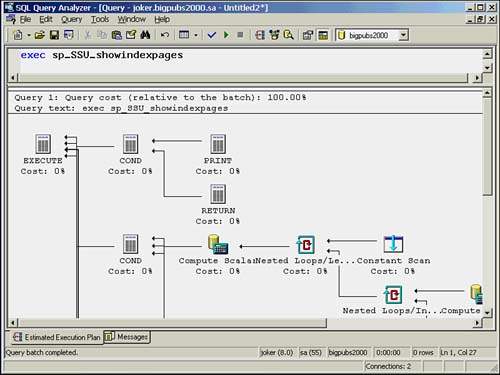
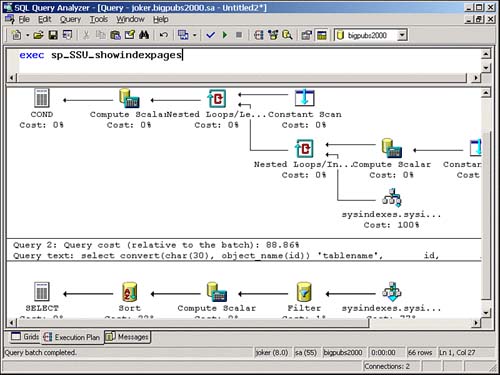
When you are able to display the estimated execution plan for a stored procedure, you will see multiple statement operators as inputs to the Execute statement operator, especially if you have any conditional branching in the stored procedure. One operator will exist for each statement that is defined in the stored procedure. At query optimization time, SQL Server does not know which statements in the stored procedure will actually be executed. An example is shown in Figure 36.6. Figure 36.6. Estimated execution plan for a stored procedure. When you execute the stored procedure with the Show Execution Plan option enabled, Query Analyzer will display only the execution plans for the path or statements that are actually executed, as shown in Figure 36.7. Figure 36.7. Actual execution plan used for a stored procedure. In addition, because stored procedures can become quite complex with multiple SQL statements, seeing the graphical execution plan in the Query Analyzer window can be difficult. You might find it easier to break up the stored procedure into smaller batches or individual queries and analyze it a bit at a time. |
EAN: 2147483647
Pages: 503