Using Reporting Services Tools to Solve Problems in Business Scenarios
| The following section discusses various scenarios and technical situations in which you may find yourself. The goal of these scenarios is to go beyond the basic step-by-steps of how to use the designers or wizards and to provide tips about and insights into some of their less obvious capabilities. The scenarios include the following:
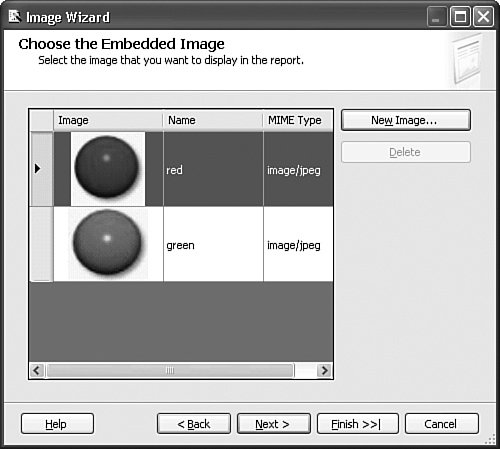
How Do I Optimize My SQL-, DMX-, or MDX-Based Report through Report Designer?You can write a Reporting Services report by using SQL against a relational database, DMX against a data mining model, or MDX against an OLAP cube. Even though Report Designer provides a wizard and a graphical query builder, the database professional authoring a report can always view the generated SQL, DMX, or MDX query and tune it. For example, if you look at a basic report sourced from the Adventure Works DW sample OLAP database, the graphical query builder embedded in Report Designer generates the query for the author shown in Figure 17-16. Figure 17-16. Analysis Services Query Designer (graphical)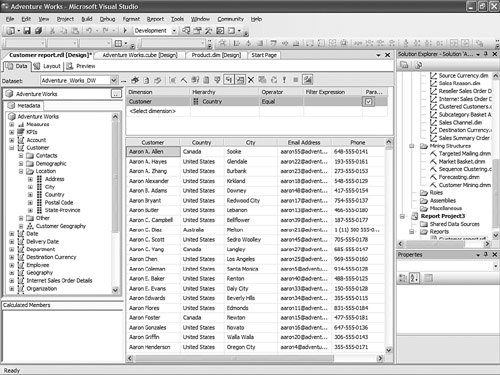 The author can look at the query behind the report and edit it if necessary. In the case presented here, by clicking on the design button at the extreme right of the embedded designer toolbar, the author can now see the MDX query generated. This MDX query is actually more sophisticated than a regular MDX query because it also contains parameterization information (e.g., the @CustomerCountry parameter embedded in the query in Figure 17-17). Figure 17-17. Analysis Services Query Designer (textual).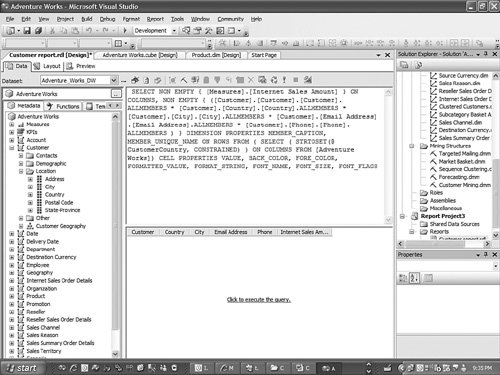 Now the MDX query can be copied out of the Report Designer and pasted in SQL Server Management Studio to change and optimize it. By looking at SQL Profiler, you can assess the performance of the query, make changes, and reevaluate it. As soon as the report author is happy with the performance of the query, it can be pasted back into the Report Designer. For this exercise, the parameters have to be taken out and replaced when the MDX query is pasted back into the Report Designer. Based on the nature of the changes, the report author may not be allowed to go back into graphical mode if the structure of the MDX query cannot be graphically displayed in simple columns format. Similarly, this method can be used for a SQL or DMX-based report. How Can I Build a Report with Both Relational and OLAP Data That Share the Same Parameter Field?In many cases, it may be important to build a report with data coming from both relational and OLAP sources and display it side by side. Reporting Services' flexibility makes it easy to build such a report. All you need to do is build a table or list based on data coming from the relational source and another with data coming from the OLAP data source. To do this, you need to define different queries against each source. If the report needs to show parameters, additional queries may need to be defined for each parameter, as shown in Figure 17-18. Figure 17-18. Multiple query definitions.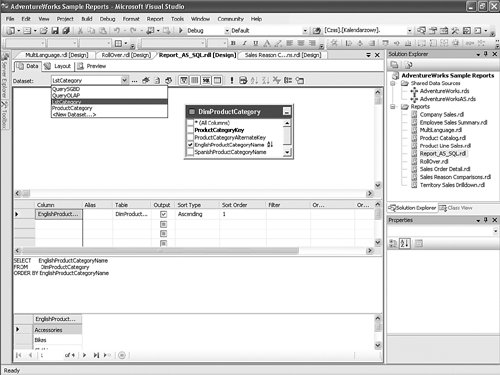 It does not make for a very elegant report if you need to use two different sets of report parameters for each section, especially if these parameters are representing the same item. So as long as the values for this parameter are the same between both sources, it is perfectly feasible to define only one set of parameter values, using a single parameter query, and reference it from both regions of the report. As shown in Figure 17-19, it is perfectly okay to have an OLAP region use a SQL-based query for parameter values. Figure 17-19. Common parameter definition.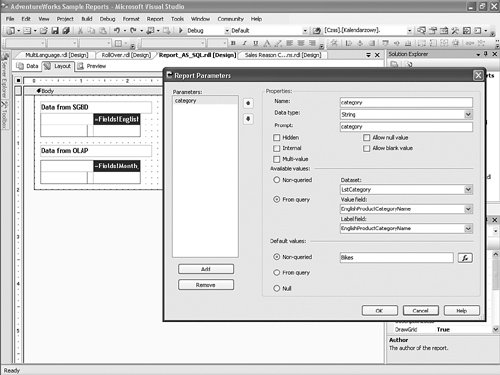 The resulting report displays the very same information twice (see Figure 17-20). Although this is not very valuable in practice, it demonstrates the fact that the same parameter can be shared between two regions based on different data sources. The result here displays the same data, but coming from both OLAP and relational data sources. Figure 17-20. Previewing multi-source report with a common parameter.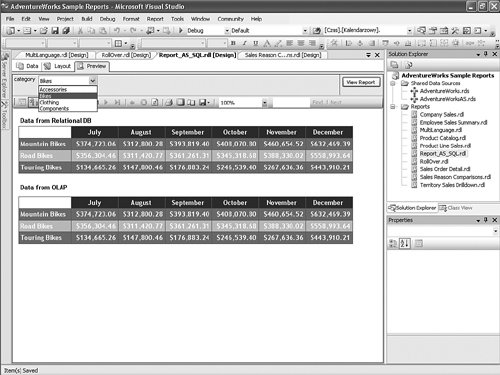 The report presented in this scenario is provided on the book's CD, named Report_AS_SQL.rdl. The report project containing this report and others described in this chapter can be deployed on your report server as long as the AdventureWorks DW OLAP project has been deployed on this machine previously. How Do I Use Report Designer to Bring KPIs into a Report?One of the most popular questions we get is "How do I display Analysis Services Key Performance Indicators (KPIs) in a report?" In the Analysis Services chapter, you saw how to display KPIs with Report Builder. In this case, it turns out that Report Builder is better than Report Designer in terms of exposing KPIs. The reason is that you cannot expect a business user to author formulas for displaying KPIs. Unfortunately, we did not have time to migrate the work done in Report Builder into Report Designer as it was done toward the very end of the product cycle. Although you can expect this to be addressed in a future release, for now it must be done manually. The good news is that you can achieve this in Report Designer with a little bit more work. First, you need to add an image field in your table. When the image wizard prompt you for images, select one of the images that you have previously embedded in your report definition, as shown in Figure 17-21. Figure 17-21. Using embedded images. Then, define an expression that alternatively displays one image or the other, based on a conditional expression, as shown in Figure 17-22. Obviously, the expression can be more sophisticated than the example in Figure 17-22 and contain as many conditions as needed. For example, if the KPI needs to be able to show five different gauges based on five different thresholds, you can accommodate this by using the Case function or nested if conditions. Figure 17-22. Image field conditional expression.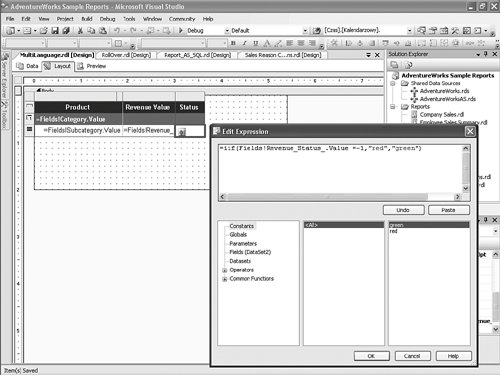 The result of such a report is shown in Figure 17-23 in the following section. Figure 17-23. Language selection in Report Viewer.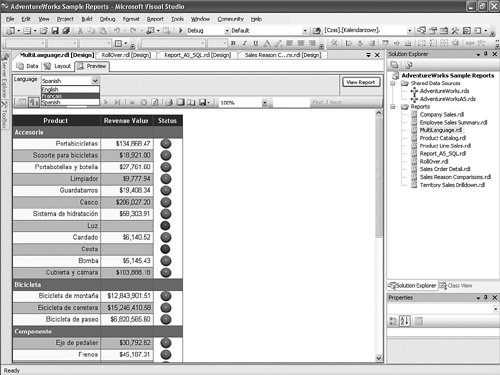 The report presented in this scenario is provided in the book's CD. It is called MultiLanguage.rdl. The Report project containing this report and others described in this chapter can be deployed on your server as long as the AdventureWorks DW OLAP project has been deployed on the machine previously. How Can I Let Users Pick Their Own Languages at Runtime to Display the Report?One of the advantages of building a report on top of an OLAP database is the fact that an OLAP database can be fully localized. All metadata and data can be localized in as many languages as are supported by Microsoft Windows. The benefit is that end users can, at runtime, select the language that they want to use to display the report, as shown in Figure 17-23. The trick here is to be able to pass the selected language Locale Identifier in the connection string. As shown in Figure 17-24, you can do so by using the GetLCID() function and passing the parameter value as a parameter for it. Figure 17-24. Locale Identifier dynamic definition in connection string.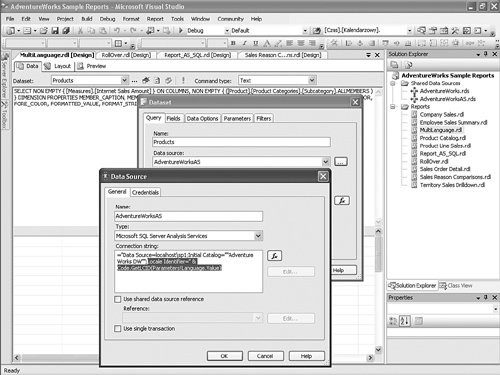 The report presented in this scenario is provided on the book's CD. As with the previous scenario, it uses the MultiLanguage.rdl report. The report project containing this report and others described in this chapter can be deployed on your server as long as the AdventureWorks DW OLAP project has been deployed on this machine previously. How Can I Use Report Designer to Build an Asymmetrical Report?Most reports built with Report Designer are either matrix or table-based. These are commonly used for sales and marketing analytical reports or operational reports. When it comes to financial style reports, usually an asymmetrical design is needed. A typical example is a rolling forecast report that contains two areas. The first area is made of actual data shown for every month from the first month of the year until the current month (as defined by the parameter or the computer clock, for example). The second area must display budget data for the remaining months of the year, as shown in Figure 17-25. Figure 17-25. Asymmetrical report definition.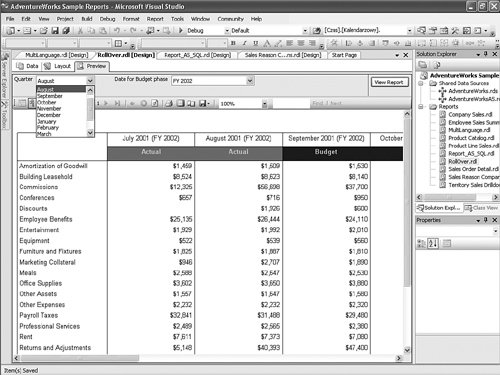 This is often easier said than done. Indeed, you may need to define a matrix-based report with a specific filter that will intelligently display the correct category of data for the correct month, based on the Month parameter value. As you can see from Figure 17-25, it is not just the data that needs to be filtered; in this case, the column header formatting needs to be set dynamically, based on the Month parameter. For the column header, the background color needs to be set to the following: =iif(Fields!Scenario.Value="Actual","SteelBlue", "MidnightBlue") For the data, it is slightly trickier. The filter needs to be set on the matrix object, as shown in Figure 17-26. Figure 17-26. Asymmetrical filter definition.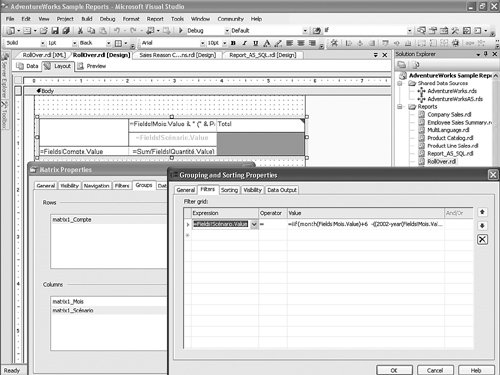 The full expression is =iif(month(Fields!Me.Value)+6 -((2002- year(Fields!Me.Value))*12) <= Parameters!Month.Value,"Actual","Budget") The calculation is pretty simple; it compares the value for the month of the current matrix column with the value for the Month parameter (see Figure 17-27). Figure 17-27. Month parameter value definition.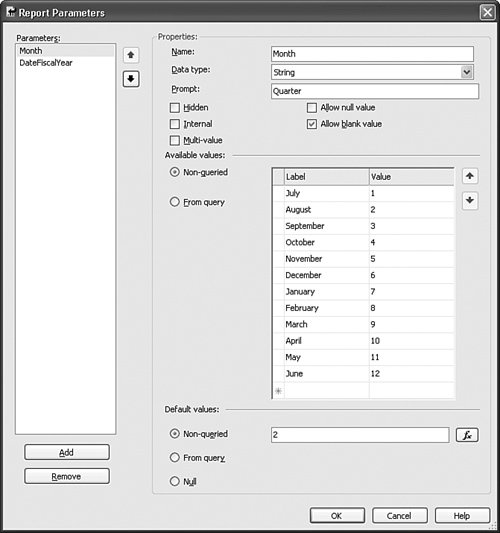 The Month parameter values are offset by 6 to comply with the fiscal year. If it was to be set on a regular calendar, it would start with January = 1 instead. So let's review this formula above an example. Imagine that the parameter is August 2002. Then for the first column of the Matrix (July 2002), the formula becomes =iif(6 + 6 -((2002-2001)*12) <= 2,"Actual","Budget") which resolves as 0<2, thus "Actual." This formula resolves similarly for the next month, August 2001, but then resolves as >2 for every other month after August 2001. The report presented in this scenario is provided on the book's CD. It is called RollOver.rdl. The Report project containing this report and others described in this chapter can be deployed on your server as long as the AdventureWorks DW OLAP project has been deployed on the machine previously. |
EAN: 2147483647
Pages: 149