Placing Objects into Microsoft Project
| < Day Day Up > |
| You can paste or insert objects into Microsoft Project in four locations:
The following sections show how to use objects in each of these locations. The following sections go into detail about pasting, inserting, and working with objects in the Gantt Chart view. The remaining sections focus on the differences compared to placing objects in the Gantt Chart view. Pasting Objects in the Gantt Chart ViewThe Gantt Chart view is the primary view for seeing a Microsoft Project file depicted graphically. You can enhance this view by pasting Project drawings (see Chapter 7, "Viewing Your Schedule") or objects from other applications into the timescale area. To paste an object into the Gantt Chart view, follow these steps:
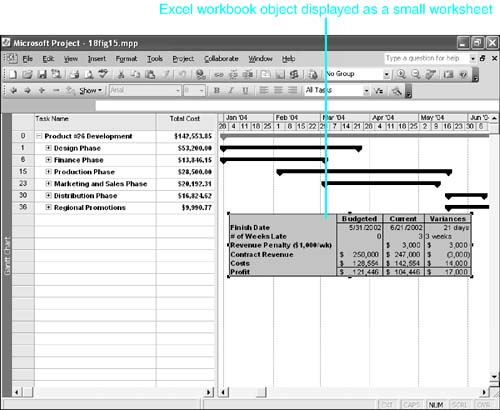
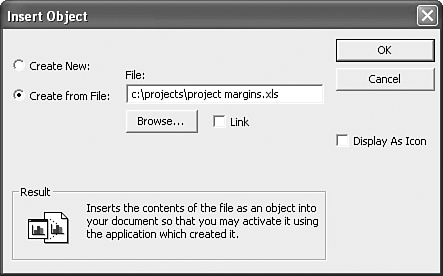
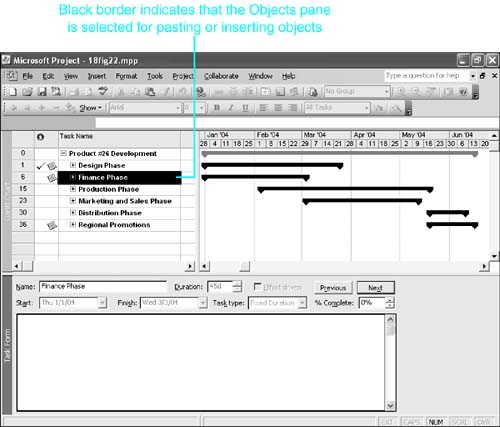
When the object appears in the Gantt Chart view, you can move and resize it. To move the object, click the object to select it, and then drag it to a new position. To resize the object, select it and then resize it by dragging its resizing handles to change its size . To remove the object, select it and press the Delete key. TIP Resizing a picture object (whether it is linked or not) might cause the data in the object to appear distorted . This is because the resizing action can cause the horizontal and vertical dimensions to go out of proportion relative to one another. To resize a picture object so that the horizontal and vertical dimensions are in proportion, hold down the Shift key as you drag one of the object's corner handles. CAUTION You can't undo resizing or deleting of an object. Be sure to save the Project document before experimenting with either of these actions. TIP If you have more than one object placed in the Gantt Chart view, you can scroll through your objects by pressing the F6 key repeatedly until the first object is selected. Then press the Tab key to select other objects in that pane, one at a time. Inserting Objects in the Gantt Chart ViewIn the examples in the preceding section, the data in an object was created as part of a source (server) application document and was then copied and pasted into the target (client) application. You can also use the Insert Object command to place a linked or embedded copy of the entire source document into the client document as an object. Of course, embedding a source document in Project increases the Project document's file size, and the embedded document is cut off from updates to the original source document. The Insert, Object command also gives you the option of creating an object without using an existing file. You can create a new object by using the formatting capabilities of server applications that support Microsoft OLE 2.0 or higher. The server application's interface opens from within Project, to allow you to create the new data. When you close the server, the object remains embedded in Project. To insert an object, choose the Insert, Object command. Project displays the Insert Object dialog box (see Figure 18.14). The default option button is Create New, which allows you to create a new, embedded object, using one of the applications listed in the Object Type box. Choose Create from File if the data has already been created and saved to disk and you want to insert a linked or embedded copy of the source data. Figure 18.14. The Insert Object dialog box gives you the option of creating an object from scratch within a Microsoft Project file. For example, suppose that you want to embed in the Gantt Chart view a new Excel worksheet object that shows budgeted (baseline) and current gross margin data for a project. To create this new worksheet object, you would follow these steps:
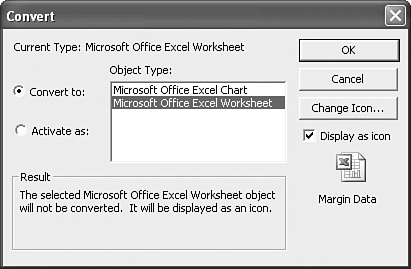
After the object is embedded, you can double-click the icon to open or edit the data. You can also convert the object to display itself as a worksheet instead of an icon. To convert the object by changing its display, follow these steps:
The previous example shows how to create a new object by using the Insert, Object command. You can also insert an object into the Gantt Chart, using a file that already exists, by following these steps:
To open or edit an object, you click the object to select it. At the bottom of the Edit menu, you see a submenu that is named for the object type. For example, the submenu for an object that originated as a worksheet might be titled Worksheet Object, and the submenu for a sound file might be titled Wave Sound Object. Depending on the format of the object, the submenu should contain one or more of these commands:
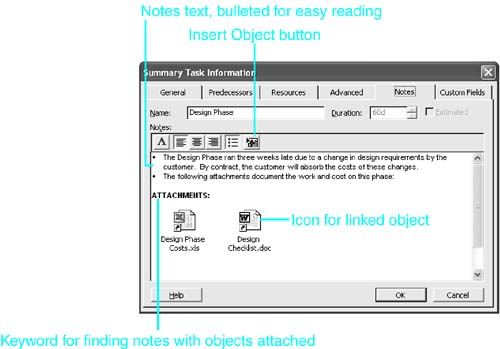
NOTE You can use the Edit, Links command to manage linked objects just as described in the section, "Refreshing Linked Data in Microsoft Project," earlier in this chapter. Placing Objects in the Notes FieldYou can place objects in the Notes field for individual tasks , resources, or assignments (see Figure 18.19). The Notes field is the most obvious place to attach links to supporting documentation that is stored elsewhere on your computer, on your organization's network, or in an intranet folder. For example, you could insert into a note a group of objects, displayed as icons, that provide links to documents that define the scope, authorization, and budget for the project; or you could insert into a task note links to drawings or specifications for completing the task. By using links to external documents, you can provide reliable access to relevant documentation. Figure 18.19. The Notes field can display embedded and linked objects as formatted data or as icons. CAUTION If you insert objects in the Project Summary Task note, they will be lost if you later edit the note in the Comments text box on the File, Properties dialog box. When you click OK after editing the Comments box, you will receive a warning that objects will be lost if you change the note. You can then choose No to cancel the changes. If you display links as icons, you do not increase the project file size by any substantial amount. If you display the linked object as formatted data, and especially if you embed the object, you may substantially increase the file size of the project document and thereby reduce the speed with which Project can open the file and process it. Furthermore, as the following Caution points out, a linked object in a note is not updated until you double-click the object to open the source document. CAUTION You will not find the linked objects you place in notes in the Links dialog box when you choose Edit, Links. The only way to update a linked object in a note is to double-click the object to open the source document. Because linked objects in a note are not listed in the Links dialog box, if you change the filename or path to a linked object, you must delete the original link and place the object in the note again. The only drawback to using the Notes field as a repository for links to supporting documentation is that there is no automatic way in Project to identify the notes that contain links to external documents. Although there is a filter called Tasks with Attachments, this filter displays all tasks with any type of text in the Notes field, whether those Notes contain any attachments or not. Thus, you have to find the links on your own. TIP Because there is no filter or indicator to tell you if a note contains an object, you should adopt the habit of placing a keyword such as Attachments just before the inserted or pasted objects in a note. Then you can create a custom filter to search the Notes field for notes that contain the text Attachments . You must place this keyword before any objects because the Find command stops searching a note when it encounters an object. You can paste objects into a note by using the Paste or Paste Special commands on the shortcut menu for the Notes box. You can also insert objects in notes by using the Insert Object tool that is displayed above the Notes box (refer to Figure 18.19). If you paste objects, you can only embed themthere is no paste-link option within notes. If you insert them, however, you have the choice of embedding or linking most objects. To paste an object into the Notes box, follow these steps:
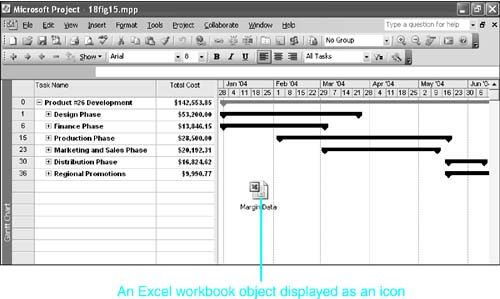
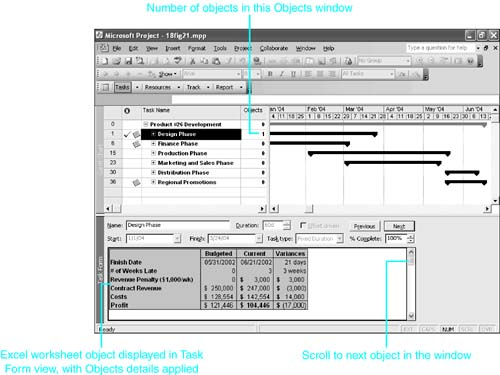
TIP The Notes box in the Information dialog box cannot be enlarged, and you might find it too small for your tastes. You can increase the display size of task and resource notes (but not assignment notes) by viewing them in the Task Name Form view or the Resource Name Form view. These views can be displayed as full-screen views or in the bottom pane of a split window, under a task or resource view. Placing Objects in the Task or Resource Objects BoxProject has three standard task form views (the Task Form, the Task Details Form, and the Task Name Form views) that can display an Objects box, in which you can place objects that you want to associate with a task. Similarly, there are two standard resource form views (the Resource Form and the Resource Name Form views) that can display an Objects box for displaying objects that you associate with a resource. These forms are the only places you can view an Objects box onscreen. However, you can include the contents of the Objects boxes in custom reports (see Chapter 22, "Using and Customizing the Standard Reports "). You can paste objects in the Objects box by using either the Paste or Paste Special commands, and unlike with pasting notes, you can paste links to objects by using the Paste Special command. You can also use the Insert Object command to place embedded or linked objects in an Objects box. Project also has a task Objects field and a resource Objects field. If you display the Objects field in a table, it shows the number of objects that are stored in the Objects box for that task or resource. The main usage of the Objects field is in filters, to identify tasks or resources that have objects in their Objects boxes. The standard filters Tasks with Attachments and Resources with Attachments select those tasks or resources whose Objects field have values greater than zero or whose Notes fields contain some text. You could make a custom filter to focus on just records that have objects stored in their Objects boxes. In Figure 18.21, the Task Form view is displayed beneath the Gantt Chart view, with the Objects box displayed in the details area. The gross margin worksheet that was used in previous examples is displayed in the Objects box. Figure 18.21. The Objects field displays objects that are attached to an individual task or resource. The table in the Gantt Chart has been modified to display the Objects field. It shows that there are two objects attached to this resource. You would use the scrollbar next to the Objects box to see the next object. To paste an object into an Objects field, follow these steps:
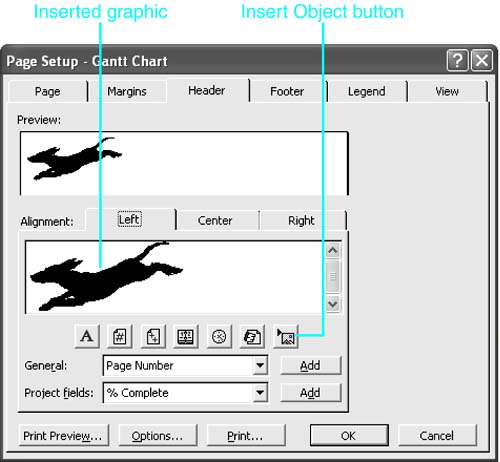
To insert an object in the Objects box, select the Objects box and choose Insert, Object to display the Insert Object dialog box, and use the dialog box options as described previously for inserting objects in notes and in the Gantt Chart view. You can place multiple objects in the Objects box. The first object you paste or insert appears immediately and is selected. When you place additional objects, they are inserted below the one that is currently selected and displayed. However, the selection does not change and the new object is not displayed. You can use the scrollbar or the down arrow to select and display the newly placed object. TIP If you have multiple objects placed in an Objects box and would like to change the order in which they appear, you can use the Cut and Paste tools to move objects in the stack. Display the object to be moved and choose the Edit, Cut command. Then select the object after which you want to place the cut object and choose the Edit, Paste or Paste Special command. If the object being moved is not formatted as a simple picture object, you must use the Paste Special command to retain its format. TIP The Objects box scrollbar does not scroll through a single object, even if it is too large for the area it is displayed in. If you can't see the entire object, increase the size of the form. If you still can't see the entire object, open it in the server application. You cannot resize the objects that are pasted in the Objects box. If the object is pasted as a picture and you can't see all of it, you are out of luck. If you want to delete an object in the Objects box, scroll to display that object and press the Delete key. The object is then deleted from the document. Placing Objects in Headers, Footers, and LegendsYou can customize printed views and reports by placing graphics such as an organization's logo or a symbol for the project in the print header, footer, or legend area. In Figure 18.23, the running dog graphic has been inserted into the left header in the Gantt Chart Page Setup dialog box. This graphic represents the logo for this project. You can either paste a picture or insert a graphic file to create the object in this context, but you can only embed objectsyou can't link them. Figure 18.23. You can place objects such as a company logo or project logo in print headers, footers, or legends. To place a graphic object in a view or report's header, footer, or legend, you must first display the Page Setup dialog box for the view or report. For views, you simply display the view and then use the View, Header and Footer command. You can also use the File, Page Setup command and then click the Header or Footer tab. To place a graphic object in a report, follow these steps:
NOTE You cannot define a legend for any of the reports, and the Project Summary report doesn't even allow you to create a header or footer. When the Page Setup dialog box is active, follow these steps to embed a picture:
|
 For more information on working with objects in the Gantt Chart view,
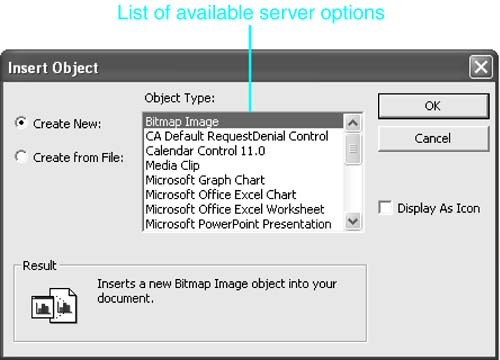
| < Day Day Up > |
EAN: 2147483647
Pages: 283