Exchanging Selected Parts of a Project with Other Formats
| < Day Day Up > |
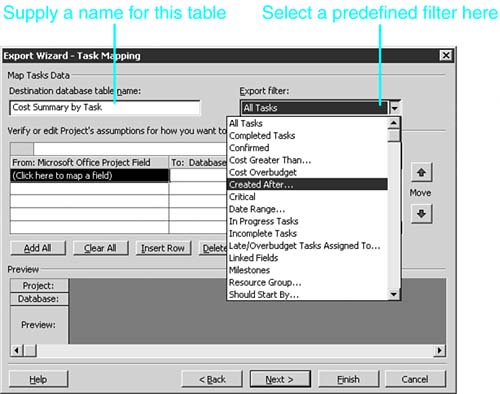
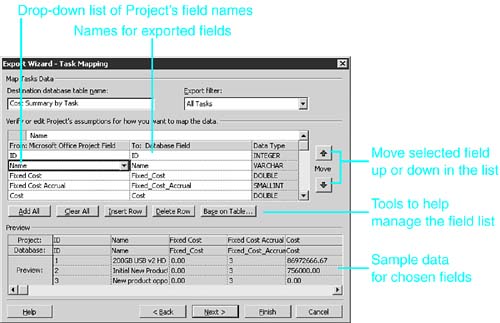
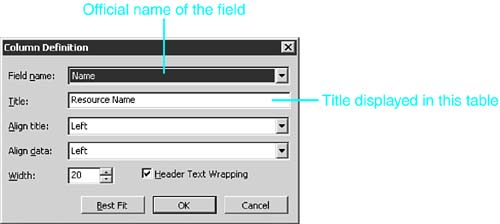
Exchanging Selected Parts of a Project with Other FormatsFor some file formats, you are allowed to store only selected field values from a Project file. This is true for the Microsoft Excel format, the HTML format, and the text formats. In other instances, you simply might not want to save all of a project's information. For example, a colleague might ask you to provide an Access database that records just the task names , scheduled work, and actual work for a project, so that she can help estimate task work in a similar project. When you save an entire project in a database, Microsoft Project automatically creates a standard set of tables in the database, with standard Microsoft Project database field names. If you save only part of a project's data to a database, you need to provide the name of the new or existing table(s) that will receive the data. If you choose to save only parts of the project in one of the export formats, you must use an Export map to define which fields you want to export from Project and what you want to name the table or tables in which they will be stored. If you plan to change the values in the other format and then import the data back into Project, you must use that same map or a similar map as an Import map to tell Project where the imported data is to be inserted in the Project data structure. Working with Import/Export MapsAll Import/Export maps specify which tables and fields in a foreign data format will be matched with tables and fields in Microsoft Project's native format. A map allows you to define tables in the foreign format to match the data in Project's native tables. You can define the following tables in an Import/Export map:
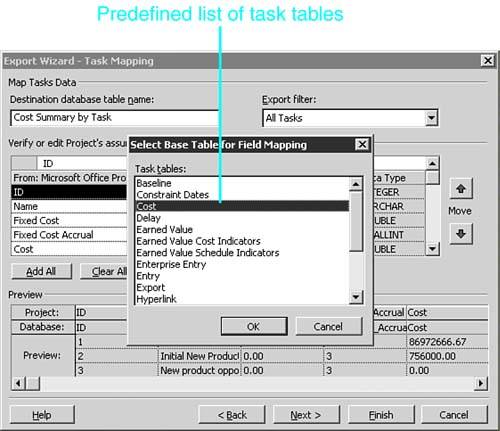
NOTE You cannot import or export Project's timephased data by using Import/Export maps. For each table in a map, you must specify the field name in Project and the corresponding data location in the foreign format. Option buttons make it very easy to add all Project fields to the table or to add the same set of fields that appear in one of the already defined tables in Microsoft Project. For Export maps, you can choose to export a subset of the tasks or resources in the project by applying one of the predefined Project filters. For import maps, you can choose how the imported data will fit into the open Project file. These are the options:
Import/Export maps are not file-formatspecific; that is, if you design a map to export data to Access, you can use the same map to export data to an ODBC data source, to a text file, or to an Excel worksheet. However, the different file formats often convert non-text fields into different field types and different values. For example, if a resource is assigned eight hours of work on a task, the same export map would export those eight hours as the text value 8 hrs to an Excel worksheet, and to an Access database as the number 480,000 (1,000 times the number of minutes in eight hours). Furthermore, some maps export more data to one format than to another. For example, the Who Does What Report map exports more data to an HTML document than it does to an Access database (see the section "Using the Who Does What Report Map," later in this chapter). NOTE When you choose to save Project data in a non-Project format, Project modifies the options that are shown on the Import/Export map to match the format you chose. For example, if you choose Save As for an HTML format, and then you choose an Import/Export map that was originally designed for exporting to an Excel worksheet, the worksheet options are replaced by HTML options. You must be very careful when using a map to import data into Project. A map designed for one database or worksheet might specify tables or fields that are not used in another data source. Always check the structure of the map before using it to import data. Import/Export maps are saved in the GLOBAL.MPT file, rather than in the active Project file when you create them. You do not have to use the Organizer to rename a map. Rather, when you are editing a map, you can simply change its name. You must use the Organizer to delete a map. TIP To share a map with other users, you can use the Organizer to copy the map into an open project file and then save the project. The other users can then open your project file and use the Organizer to copy the map into their GLOBAL.MPT files. Reviewing the Predefined Import/Export MapsMicrosoft Project 2003 includes 11 predefined Import/Export maps for general-purpose use. Some are like predefined Project reports , views, or tables. The predefined maps are listed in Table 17.2. For those that are intended for a specific file format, Table 17.2 notes the intended file format. Table 17.2. The Predefined Import/Export Maps
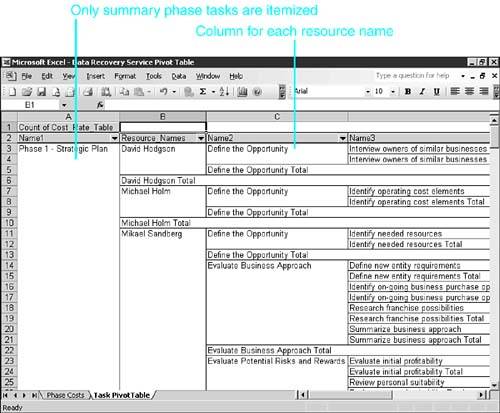
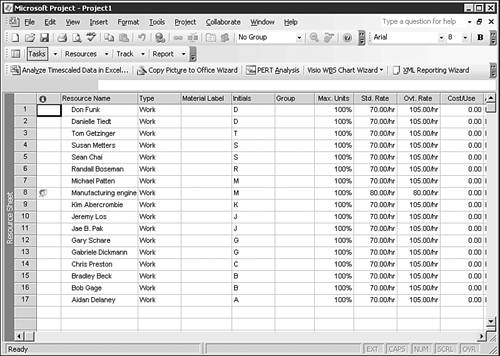
The following sections explain how these maps were created and how they can be used most effectively. All the predefined maps were designed for exporting selected data from Project to another file format. Some were designed with specific file formats in mindfor example, HTML or Excel PivotTablesbut any map can be used to export to any of the formats. Maps generally work best, however, if they are used with the format for which they were designed. Note that in all cases, the exported values for the duration and work fields are exported as text (not as numeric data), with the time unit attached as part of the text value, such as 10d . Although some maps are designed for exporting and some for importing, any map can be used for either operation. Be very careful, however, when using a map to import data into Project because the result might not be what you expect. When you use an Import/Export map to exchange data with a file that has another format, the external file that supplies or receives the data is added to the list of recently used files at the bottom of Project's File menu. For example, after you export (save) data to an Excel worksheet named TaskCosts.xls , using the map named Cost Data by Task, you see the entry TaskCosts.xls (Cost Data by Task) on Project's File menu. Because clicking a file listing causes Project to open the file, clicking the listing would cause Project to import (open) the Excel file TaskCosts.xls and copy data into a Project document, using the Cost Data by Task map to determine which Project fields receive the imported data. By default, Project's predefined maps all place imported data into a new Project document that is created on the fly. Therefore, clicking the file listing causes Project to create a new document that has the Excel data in it. You should close this new project file without saving it because the map was designed for exporting, not for importing, and the new project file is not a complete project file. When imported data is placed in a new Project document, there is no harm done because you can simply close the new document. However, import maps can also be defined so that they append the imported data to the active file or merge the imported data into existing task or resource records, updating existing field values with the values stored in the external document. If the map named in the file listing is set to append or merge, clicking the file listing alters the data in the document that is active when you click the listing. If the active document has unsaved data in it, you could lose some or all of that data as a result of clicking the listing on the File menu. CAUTION You should never open a foreign-format map file from the File menu's file list unless you're absolutely sure that you want that data imported. Even then, be sure you save the active document beforehand, just in case. Using the Who Does What Report MapThe Who Does What Report map is best used to save an HTML table of resource assignments. The resulting table is named Who Does What and is similar to the Who Does What report you can print in Project by choosing View, Reports, Assignments, Who Does What. Like the Resource Usage view in Project, the HTML table lists resource names and task assignment names in the same column with the assignment names, indented under their resource names. There are columns for the Start, Finish, and Work field values for each assignment. The data for the Work field is text data (not numeric), with the unit "hours" appended as part of the text value. Although this map works best when saving to HTML format, you can also use it to save to an Excel workbook or to one of the text file formats. When saving to Excel or one of the text formats, the resource rows are indistinguishable from the assignment rows because the assignments are not indented as they are in the HTML format. If you open the HTML document in Excel, however, the resources and assignments are formatted distinctively. TIP When saving data to Excel or a text format, you should modify the Who Does What Report map and add the field named Assignment to the table to distinguish resource names from task assignment names. Rows in the list that are resources have No in the Assignment field, whereas rows for assignments have Yes. You could apply Excel's conditional formatting to bold the resource rows based on the value No being found in the Assignment column. See the section "Saving Project Data as an Excel Worksheet," later in this chapter, for more information. If you attempt to use the Who Does What Report map to create a database table, Project doesn't include the associated assignment rows for each resource. To create database tables, you have to add to the map an additional table for the assignments and then link the tables on the resource names within the database application. (See "Working with Web-Enabled Project Data" later in this chapter for more details about the HTML format.) Using the Compare to Baseline MapYou use the Compare to Baseline map to export a table named Baseline Comparison that lists all tasks, with their Start and Finish dates as well as their scheduled, baseline, and variance values for duration, work, and cost. This map works the same way for database, worksheet, and text formats. Using the Cost Data by Task MapYou use the Cost Data by Task map to export a table named Task Costs that lists all the tasks (fixed cost, cost, baseline cost, cost variance, actual cost, and remaining cost) and their cost values. Using the Default Task Information MapThe Default Task Information map can be used to export or import the basic task fields that are included in the Task Entry table: ID, Name, Duration, Start Date, Finish Date, Predecessors, and Resource Names. This map works the same way with all file formats. Using the Earned Value Information MapYou use the Earned Value Information map to export the earned value fields for tasks to any of the file formats. It includes these fields: Task ID, Task Name, BCWS, BCWP, ACWP, SV, CV, Cost (EAC), Baseline Cost (BAC), and VAC. Using the Export to HTML Using Standard Template MapYou use the Export to HTML Using Standard Template map to export basic task, resource, and assignment values to an HTML document. The task table includes the ID, Name, Duration, Start, Finish, Resource Names, and % Complete fields. The resource table includes the ID, Name, Group , Max Units, and Peak (Peak Units) fields. The assignment table includes the Task ID, Task Name, Resource Name, Work, Start, Finish, and % Work Complete fields. See the section "Working with Web-Enabled Project Data" later in this chapter for more details about the HTML format. Using the Resource Export Table MapYou use the Resource Export Table map to export the fields that are included in the predefined resource's Export table. The resource's Export table is a fairly comprehensive set of 24 resource fields that covers the definition of the resource as well as scheduled, baseline, and tracking sums for work and cost for each resource. Using the Task Export Table MapYou use the Task Export Table map to export nearly all the fields that are included in the predefined task's Export table. The 70+ fields that are exported include task definition fields; values for scheduled, baseline, and actual work, and values for cost, duration, start, and finish; and a large number of the user -definable text, cost, duration, number, and flag fields. Using the Task and Resource PivotTable MapYou use the Task and Resource PivotTable map to create an Excel document with two PivotTables that summarize the total cost of the resource assignments. Both PivotTables are organized by resource groups and within each group by resource names. The resulting Excel file contains four sheets in all:
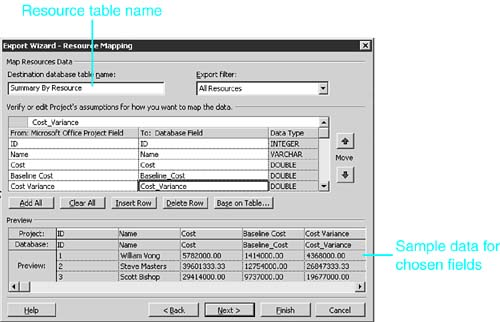
NOTE If a project has more than two outline levels, Project creates the data sheets and the PivotTables, but it is not able to perform the layout of fields for the Task PivotTable, and that sheet therefore appears to be empty. You have to do the layout manually in Excel. See the section "Exporting to an Excel PivotTable," later in this chapter, for more information about working with PivotTables. Using the Task List with Embedded Assignment Rows MapUse the Task List with Embedded Assignment Rows map to export an HTML table of tasks and their assigned resources. This map is best used to export a table that includes all the resource assignments for each task, as well as the Work, Duration, Start, Finish, and % Work Complete fields for each assignment. All the information about exporting to Excel or Access, as mentioned earlier for the Who Does What Report map, applies to this map as well. Using the Top Level Tasks List MapYou should use the Top Level Tasks List map to export a table that shows only the outline level 1 tasks. The fields include the Task ID, Name, Duration, Start, Finish, % Complete, Cost, and Work. This map works for all file formats. Creating Import/Export Maps for Access and ODBC SourcesCreating an Import/Export map is fairly straightforward when you understand the process because Project does most of the work for you. To illustrate , we will first create a map to export selected cost data for tasks, resources, and assignments to an Access database. Then we will modify the same map to import a more limited set of data from the Access database. The same map could be used for an ODBC database as well. Creating and Using an Export MapExport maps are easier to create than import maps because the Project field names are the source of the data, and you can create field names in the target format that are similar to the Project field names. When you create an Import map, the field names in the source format may not be as easy to relate to the field names in Project. To create a map for exporting some of Project's cost data to an Access 2002 database, follow these steps:
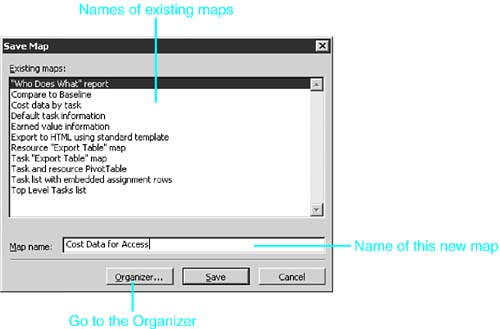
TIP If you design a map for use with one file formatfor example, with HTMLand then use the map to exchange data with an application of another format, such as Access, the results might be very different. For specialized maps it's a good idea to include the application name in the map name, as is done in the preceding example. Creating and Using an Import MapWhen you want to import data into Microsoft Project from another source, you must either find a workable import map, or create one of your own. If the data was originally exported from Microsoft Project, you can use the same map for the import that you used for the export. Or, if you want to make slight changes, it is easy to edit the export map and then save it as a new import map. The options for an import map are slightly different from those for the export map:
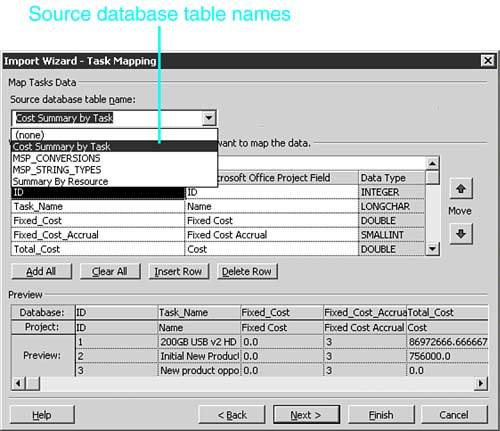
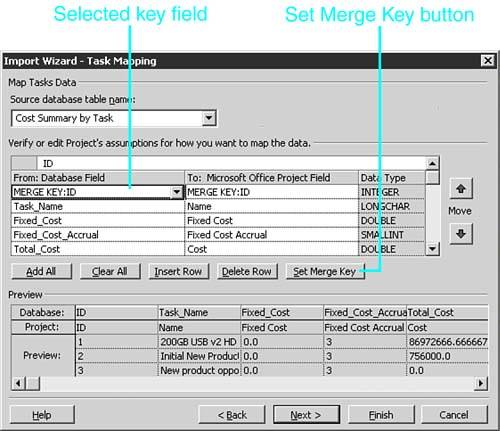
To illustrate how to import from another file format, let's import from the cost database that was created earlier in this chapter, in the section "Creating and Using an Export Map." If you intend to add the imported data to an existing Project document, you must open that project before starting the import process. Otherwise, it doesn't matter which project documents are open when you import because Project will create a new document. To import data by using a map, complete the following steps:
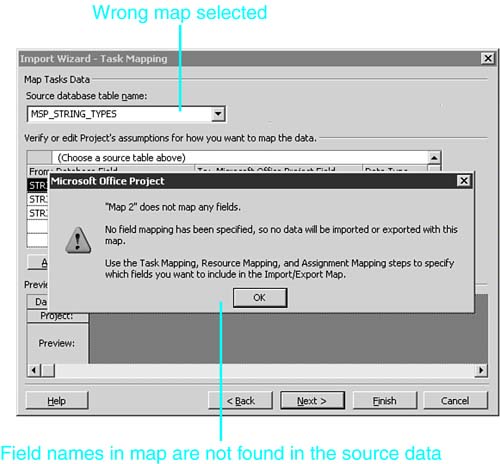
Figure 17.20 illustrates the errors you may see in the mapping tables if you choose the wrong map. If the map names source fields that don't exist in the file you have started to open, the field name entries appear in red and have an OUT OF CONTEXT: prefix in the From: Database Field column. Figure 17.20. If you have chosen the wrong type of map to import data, you will see errors in the Resource Mapping dialog box.
Working with Microsoft Excel FormatsYou can export field data to Microsoft Excel workbooks as worksheet data or as PivotTable data. Furthermore, you can import table data from Microsoft Excel workbooks, but not from PivotTables. When you export to Excel, Microsoft Project creates an Excel file in the Excel 5.0/95 format, which makes the data available to that version and all later versions of Excel. You can import from Excel documents that are saved in Excel 4.0 format or any later format, including Excel 2002. When you create an Import/Export map that will work with the Excel format, a few options are different from those for creating an Import/Export map that will work with other formats:
TIP Before using Excel's Group and Outline command, remember to change Excel's default grouping direction. Choose Data, Group and Outline, Settings and then clear the Summary Rows Below Detail check box. This places the outline symbols for grouping (the plus and minus indicators) to the left of the task or resource name (like in an Assignment view), rather than at the bottom of the list of assignments in each group. Saving Project Data as an Excel WorksheetYou can use an Import/Export map you created for another format to export Project data to Excel. You might want to use an existing map, and then save it with a different name that indicates it is used for exporting to Excel. In the following example, the map for exporting to Excel is based on the Cost Data map developed previously in the section, "Creating and Using an Export Map." To export Project data to an Excel workbook, follow these steps:
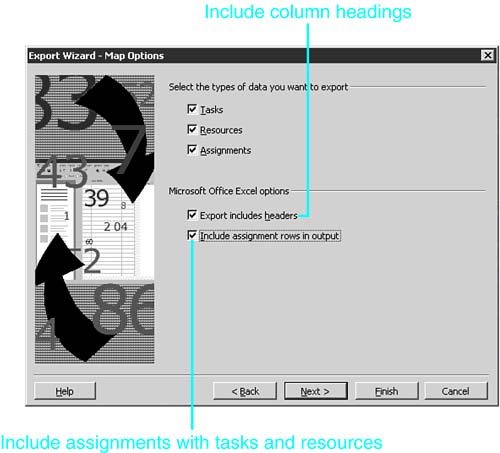
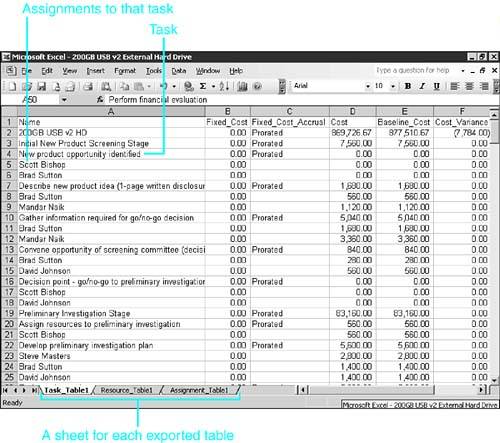
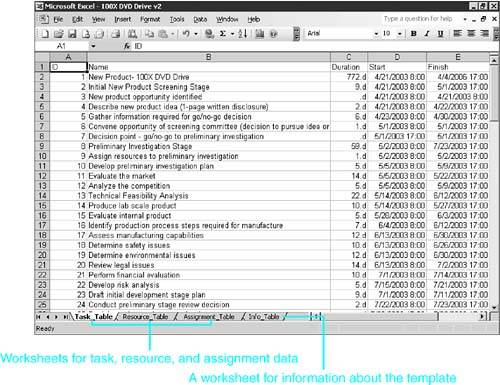
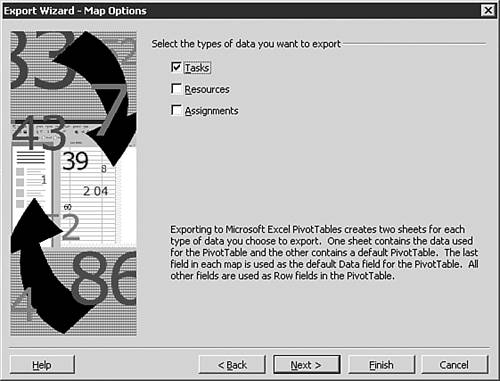
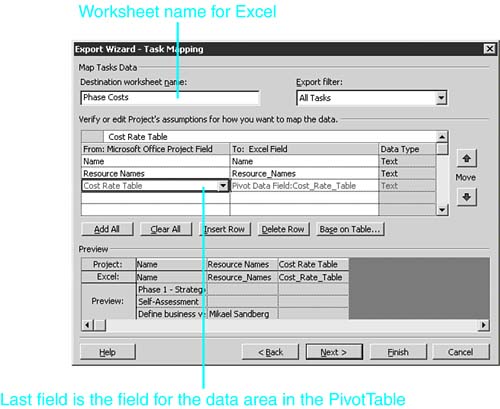
When the exported data is opened in Excel, there is a worksheet for each of the tables that were defined in the export map in Project (see Figure 17.22). As specified in the export map, the field names appear in the first row of the worksheet, and the assignments for each resource are listed under the row for the resource. Figure 17.22. The Excel workbook shows the Project data that was exported. The New Product Opportunity Identified task and its assignments are selected on the Task Table1 worksheet. CAUTION Be very careful about sorting. If you sort the rows in the worksheet, you will not be able to tell which assignments go with which tasks or resources. The Data dialog box in the Import/Export Wizard includes the option Project Excel Template, which is for exporting data to Excel. This option exports data to Excel quickly, using a template or standard list of fields for task, resource, and assignment information. The standard task fields exported to Excel are ID, Name, Duration, Start, Finish, Predecessors, Outline Level, and Notes. The standard resource fields to be exported are ID, Name, Initials, Type, Material Label, Group, Email Address, Windows User Account, Max Units, Standard Rate, Cost Per Use, and Notes. The template exports the following assignment fields: Task Name, Resource Name, % Work Complete, Work, and Units. When you use the Project Excel Template option to export data to Excel, an Excel workbook is created that contains four worksheets, named Task_Table, Resource_Table, Assignment_Table, and Info_Table. The first three worksheets contain the type of data described by the worksheet name. The Info_Table worksheet contains general information about how to use the Project Excel Template. Figure 17.23 shows an Excel workbook that was created by using the Project Excel Template option and was then formatted by the user for ease of use. Figure 17.23. The Excel workbook shows the Project data that was exported by using the Project Excel Template option. For information on how to use the Project Excel Template to import Excel data into a Project file, see "Importing Project Data from the Excel Format," later in this chapter. Exporting to an Excel PivotTableExcel PivotTables summarize data in crosstab calculations, and they offer impressive flexibility for quickly changing the layout of the PivotTable. When you export to the Excel PivotTable format, the export map lets you choose the fields to be included for one or more of the three categoriestasks, resources, and assignments. A separate PivotTable is created for each category, and all these PivotTables are stored in the same Excel workbook. The save operation not only copies the selected data into Excel data sheets, but it also creates the PivotTables on separate worksheets that are based on the data sheets. To show how this works, let's export task and resource assignment costs to an Excel PivotTable. For this example, each record contains the name of a top-level task (a phase of the project), the name of a resource assigned to a task in that phase, and the scheduled cost of the assignment. The resulting PivotTable should display the data in a compact table that neatly summarizes the following items:
Creating a PivotTable such as this involves exporting the data and then fine-tuning the PivotTable in Excel to produce the results you want. The export operation creates only the simplest of PivotTables, but you can edit the PivotTable yourself to fine-tune the display of data. To export Project data to an Excel PivotTable, follow these steps:
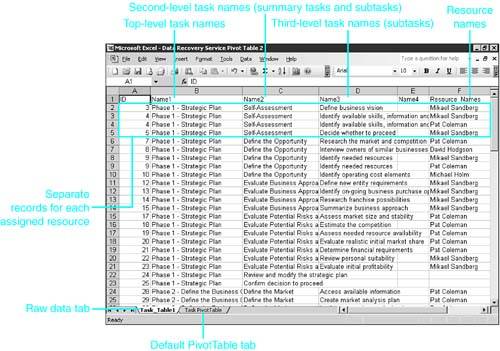
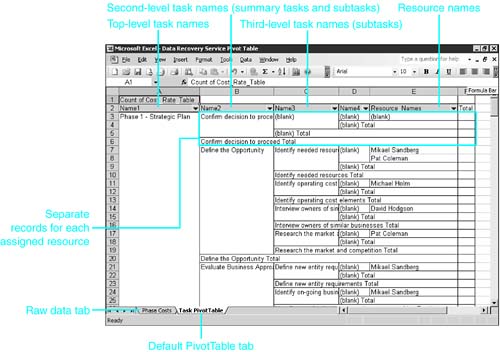
You can open Excel to see the data and PivotTable you have created (see Figure 17.26). You should see two sheets in Excel for each data category (tab) you exported. In this example, only the Task category is used, so you see a single pair of sheets. The first sheet contains the raw data you exported in a table; you could use this data to create a PivotTable on your own. Figure 17.26. Project places all the data you export into a plain worksheet that is the source for the PivotTable. NOTE If you include the Task Name field in the Task Mapping list of fields, Project creates multiple Task Name columns in the worksheetone for each outline level. For any subtask, the outline level 1 summary tasks will appear in the Task Name 1 column, the outline level 2 summary tasks will appear in the Task Name 2 column, and so forth (refer to Figure 17.26). NOTE If you include the Resource Names field in the Task Mapping list of fields, Project creates a separate record for each resource name assigned to the task (refer to Figure 17.26). The second sheet contains the default PivotTable that Project created (see Figure 17.27). You will almost always need to fine-tune the PivotTable that is created. Not only do you need to format things like column widths and the display of numbers, but you also need to adjust the layout of the PivotTable. Specifically, there are no column categories in the default PivotTable, but we want the resource names to appear as column headings. Also, there is only one calculation in the data area, and we want to show the percentage distribution in addition to the sum of the costs. Figure 17.27. The default PivotTable that Project creates rarely displays the project information the way you want to see it, so you probably need to modify the PivotTable to create the finished product.
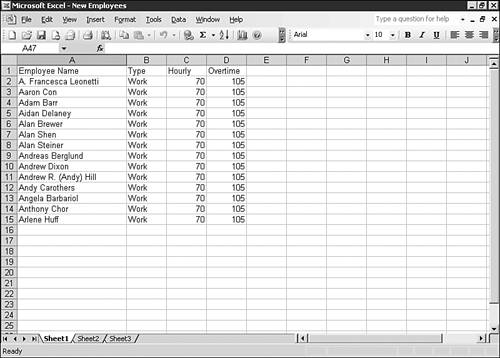
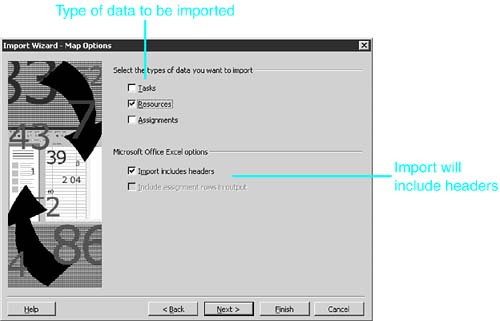
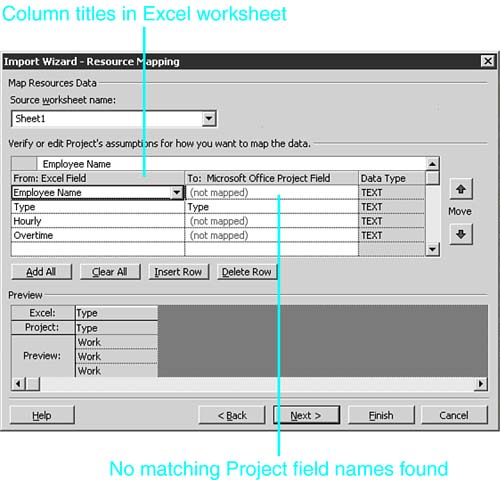
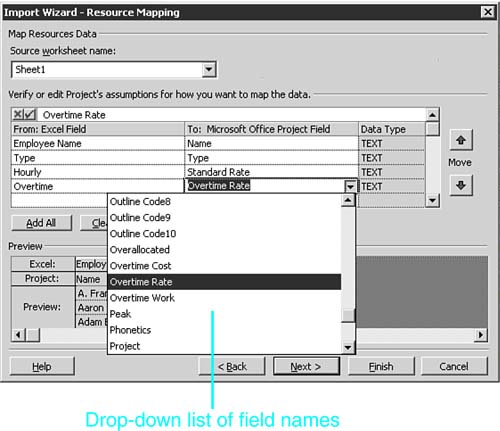
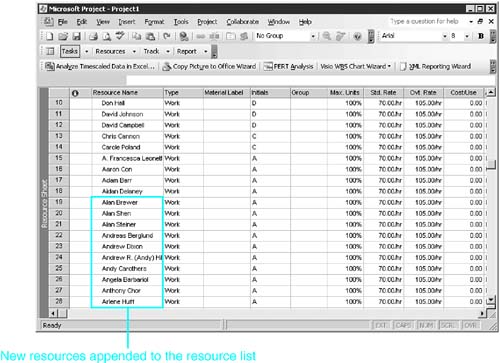
NOTE For information on how to format Excel PivotTables, see Chapter 24, "Using PivotTables and PivotCharts," in Special Edition Using Microsoft Excel 2003 by Patrick Blattner (published by Que). Also, there is an excellent section of Help articles in Excel 2002 on how to use PivotTables effectively. Look for the article on "Ways to Customize PivotTable Reports" in the Excel Help topics. Figure 17.28 shows a sample of the finished PivotTable, after it is edited. The PivotTable in Figure 17.28 shows only the top-level tasks that are summary tasks (in other words, top-level tasks that do not summarize phases have been hidden). The resource names appear across column headings, with data for each resource in the column below its name. A second calculation has been added, to show the percentage of the phase costs attributable to the resource in that column. This figure also shows a few minor formatting changes (zero values are suppressed, decimals are removed, and so forth) that improve the readability. Figure 17.28. With task details suppressed and a few other formatting changes, the PivotTable is presentable. Importing Project Data from the Excel FormatYou must be extremely careful when importing data from Excel into a Project file. You have to be sure that the data is mapped to the correct Project fields and that the data type is appropriate for those fields. CAUTION As explained earlier in this chapter, if the Excel workbook was created by exporting tasks or resources from Microsoft Project, and if the option to include rows for resource assignments was selected, some of the rows in the workbook will be tasks (or resources) and others will be assignment details. Do not attempt to import data from a workbook such as this. Identify and remove the assignment details before attempting to import the data back into Project. The example that follows shows how to add a list of new employees to the resource sheet in a Project file. The list is stored in Sheet 1 of an Excel workbook. The names are to be added to the Resource data in the New Product Project file. The column headings are not exact matches for Project field names, and there are text entries in the overtime rate field, where Project expects to find only numbers. Figure 17.29 shows the data from the worksheet. Figure 17.29. The New Employees workbook contains new resources and their pay rates, which can be imported into Project. To import the data from Excel into the Project file, follow these steps:
If Project has a problem converting data that is being imported into a Task field, you might see a warning message. Project is not nearly as forgiving when importing Task data, as you can see in the error message shown in Figure 17.36 for a mismatched Duration value. If you see an error message while importing data into a project, select one of the following options:
Figure 17.36. If there is a data mismatch during an import operation, Project warns you and lets you choose how to proceed. CAUTION Mismatched data is not imported into Project, and the affected field in Project displays a default value. You need to find these holes in the data and manually supply the correct information. It's a good idea to jot down the source references in the warning message (refer to Figure 17.36). If you are importing a lot of data at once, the references can help you locate the problem in the source file so that you can determine where to look in the Project file to fill in the missing information. If you prefer to begin a new project in Excel and then import it into a Project file, you can use one or both of the new Project Excel templates that ship with Project. When Project 2003 is installed, two Excel templates Microsoft Project Task List Import Template.xlt and Microsoft Project Plan Import Export Template.xlt are installed in the standard Office folder. To begin a project in Excel, open Excel, and then click File, New and select one of the two Excel templates from the list. Microsoft Project Task List Import Template.xlt contains the same four worksheets (Task_Table, Resource_Table, Assignment_Table, and Info_Table) that are exported from Project to Excel when you select the Project Excel Template option in the Export Wizard. This template also contains the same fields that are exported from Project to Excel. Microsoft Project Plan Import Export Template.xlt is much simpler in content than the other template, with only two worksheets (Task_Table and Microsoft_Project) and seven fields (ID, Name, Duration, Start, Deadline, Resource Names, and Notes). Create a new workbook by opening one of these two Excel templates, and then create your list of tasks, resources, and/or assignments, which can then be imported into Project. As you enter project data in Excel, be very careful about any data entered in a field that is a numerical field in Project, such as Duration, Work, Start, and Finish. Keep the following points in mind as you enter project data in an Excel template:
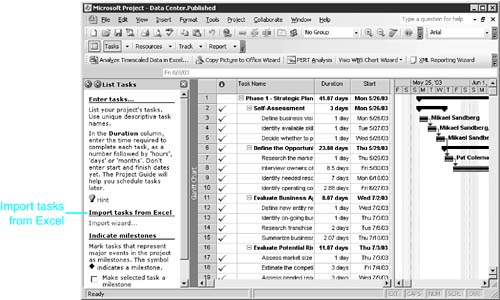
A quick way to add a list of tasks into a Project file is to use the new Project Guide sidepane to the left of the project file. To import tasks from Excel into a project using the sidepane, complete the following steps:
CAUTION When you are importing task start or finish dates, Project treats the imported dates as though you had typed them instead of letting Project calculate them. In other words, the tasks are assigned the soft constraint Start No Earlier Than (for fixed-start-date projects) or Finish No Later Than (for fixed-finish-date projects). You can reset these task constraints to As Soon As Possible or As Late As Possible after the tasks are imported into Project. TIP If you are importing dates and there is no time of day attached to the source date, Project assigns the start time of the project to the Start field on each task and the time of midnight to the Finish field on each task. If there is a time of day attached to the date, Project keeps the time, unless it falls before the default start time or after the default end time (as defined on the Calendar tab of the Options dialog box); in this case, Project substitutes the default time of day. Working with Web-Enabled Project DataYou can create pages for an intranet site or the Internet by exporting Project data to the HTML format, which is currently the standard format for Internet browsers. You can save Project data to the HTML format, but you cannot import Project data from the HTML format. Another feature of Project 2003 is the ability to export project data in the XML format. XML is the standard language for describing and delivering data on the Web, just as HTML is the standard language for creating and displaying Web pages. The XML format is similar to HTML, and it is complementary to HTML for publishing Project data to Web pages and for viewing either on the Internet or on corporate intranets . Unlike HTML files, however, XML files can be imported by Project 2003 as well as exported. To save a project to an XML file, follow these steps:
When saving a Project file in XML format, the entire project file is exported to the file; you cannot export only selected data from the plan. Unlike with HTML files, Project can import as well as export XML files. To import an XML file, follow these steps:
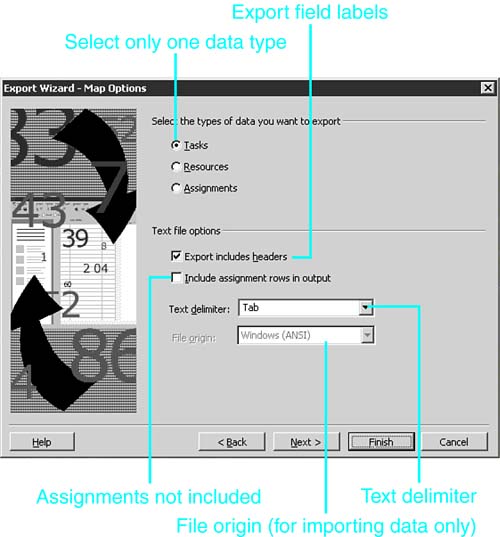
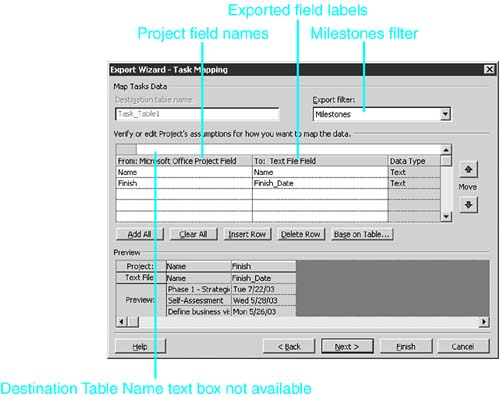
The XML file is imported into either a new project or your active project, depending on your choice in step 6. Working with Text File FormatsProject supports two ASCII text formats: the tab-delimited and comma-separated value (CSV) formats. The Import/Export maps for both of these formats are almost the same as the Import/Export maps for Excel, but with one key difference. With Excel, you can import or export task, resource, and assignment data tables simultaneously . With text formats, you can import or export only one of those three data tables at a time. Exporting Project Data in the Text FormatsTo export a list of project milestones to a text file, follow these steps:
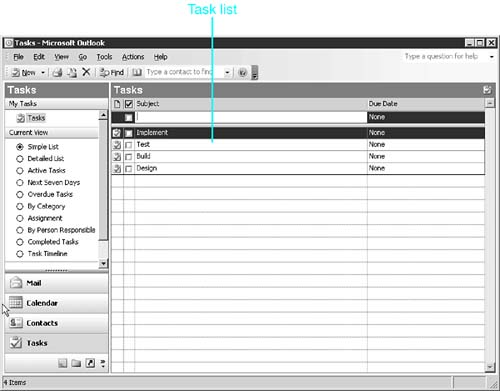
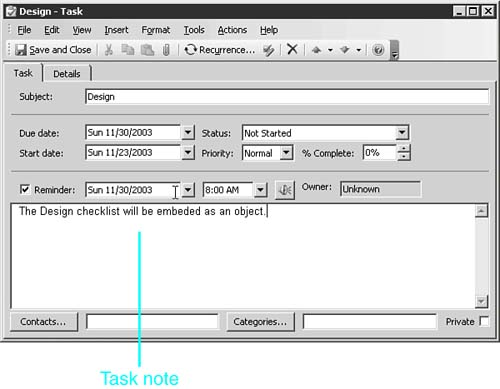
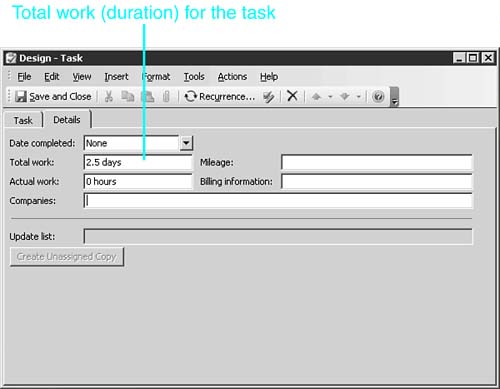
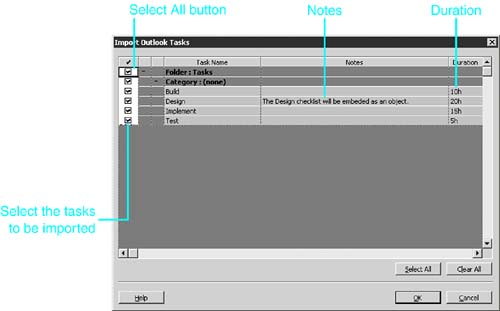
The resulting text file can be opened and viewed in Notepad (see Figure 17.40) or any other text editor. It can also be imported into other applications that can import data from a tab-delimited text file. Figure 17.40. The New Project.txt file is opened in Notepad. Importing Project Data from the Text FormatsImporting from a text file is similar to importing from an Excel workbook, except that you can import only one type of data at a timeyou must import tasks, resources, and assignments separately. (See the previous section, "Importing Project Data from the Excel Format," for more information.) With text files, you are likely to encounter the same problems in matching field names that are found with Excel formats when the import source file was not originally exported from Project. When importing from a text format, you have an additional option, which is grayed-out for exporting in Figure 17.38. You can use the File Origin text box to specify a different character set for the source data. The default is Windows (ANSI), but you can also select DOS or OS/2 (PC-8), or you can select Unicode. This maximizes your chances of importing the data correctly, knowing that text files may have originated in an OS/2 environment, or in an international environment where a text file might be created using Unicode as its character set. Importing a Task List from OutlookProject 2003 has the ability to import a task list from Outlook. Because many people use Outlook to track their to-do lists of tasks, Project now makes it easy to import tasks directly from Outlook. Figure 17.41 shows a small list of tasks that has been entered into Outlook. Figure 17.41. You can type a task list in Outlook and later import it into a Project file. Figures 17.42 and 17.43 show the additional information that can be entered for each Outlook task, including notes and durations for each task. To add this information, double-click on the task and add the information. Figure 17.42. The Task tab allows you to add notes for each task. Figure 17.43. The Details tab for each task allows you to enter Total Work (a duration) for the task. To import a task list from Outlook into a project, follow these steps:
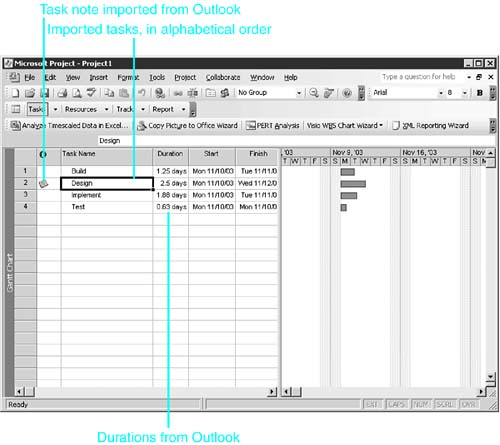
The Outlook tasks are imported into your Project file in alphabetical order (see Figure 17.45). At this point, you can drag the imported tasks into the proper sequence, set task dependencies and constraints, and so on. Note that Project ignored the start date for each task in Outlook while it imported the tasks. The start date for each imported task is set to the start date of the project. Figure 17.45. Tasks are imported from Outlook into the Project file, including a note and duration for each task. |
 For more information about Projects predefined filters,
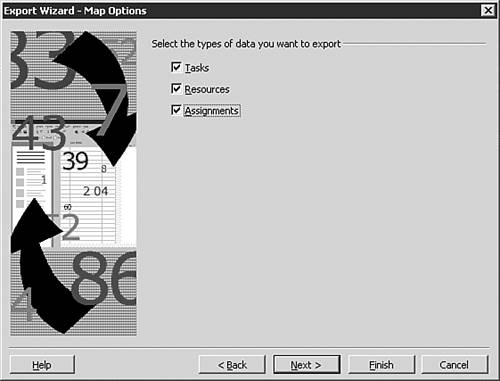
| < Day Day Up > |
EAN: 2147483647
Pages: 283