Reviewing the Current Status of a Project
| < Day Day Up > |
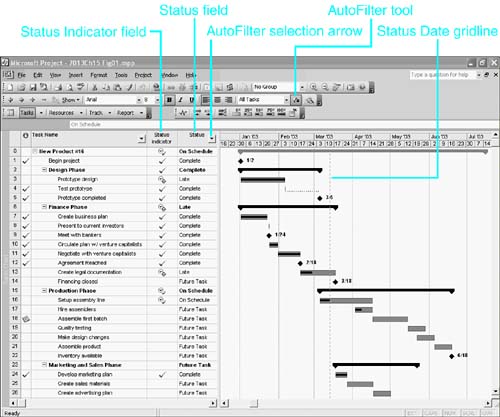
| The first level of analysis is to simply review progress vis- -vis the current schedule and to assess the effects of actual performance on Project's estimated finish date and cost for the project. To do this you can use the Status and Status Indicator fields, or you can use the graphical progress lines to quickly distinguish between the tasks that are on schedule and the tasks that are behind schedule. You can also use reports and views that show how the actual performance has modified the scheduled finish date and cost of the project that was captured in the baseline. Reviewing Status vis- -vis the Current ScheduleThe first line of defense against having a project finish late is to watch for tasks that are behind schedule. Project 2003 provides two fields that you can add to a table to see instantly whether there are unfinished tasks that are behind schedule. Or you use progress lines in the Gantt Chart view if you prefer to see this information in a graphical display. You can also apply special filters that allow you to focus on just the tasks and assignments that are slipping. Using the Status and Status Indicator FieldsThe current schedule tells you when tasks are supposed to finish, and it also contains timephased data that shows how much work should be completed during each day of the project. If tracking information has been accurately recorded, then you can look at the schedule for any given date to see if the tasks that should be finished by that date are finished and if the tasks that should be partially completed are progressing as scheduled. The Status field does this comparison for you and labels each task as completed, in progress and on schedule, in progress and behind schedule, or as a future task (not yet due to be started). It uses the status date that you enter in the Project Information dialog box for this comparison, or, if you haven't entered a status date, it uses the current date. To set a status date, choose Project, Project Information, enter the date in the Status Date field, and click OK. To clear the Status Date enter NA in the Status Date field. The Status Indicator field does exactly the same thing as the Status field, but it displays an indicator instead of a text label. Figure 15.1 shows the Status and Status Indicator fields, showing which tasks are complete, which are on schedule, which are late (behind schedule), and which are future tasks. Figure 15.1. The Status and Status Indicator fields quickly reveal the tasks that are behind schedule. The four status labels and their indicators are listed in Table 15.1. Table 15.1. Status Labels and Indicators
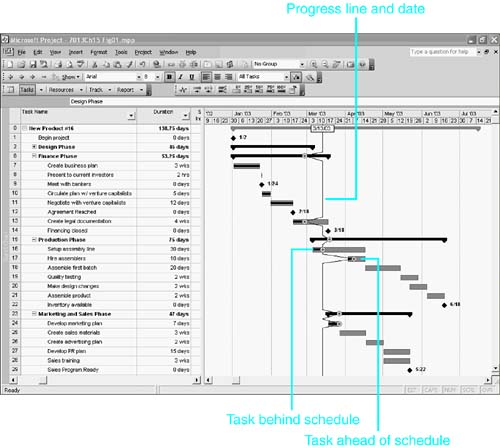
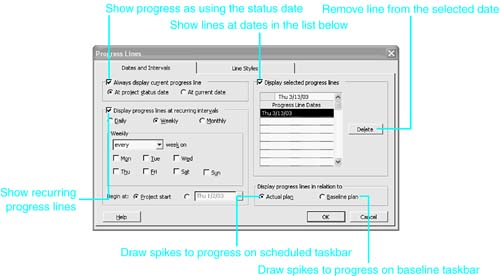
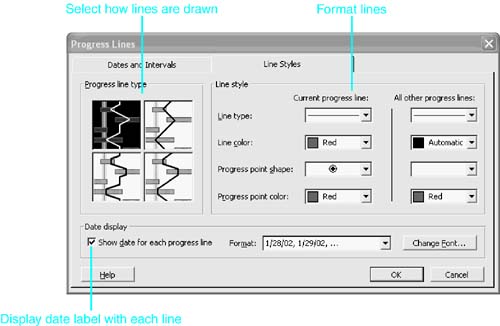
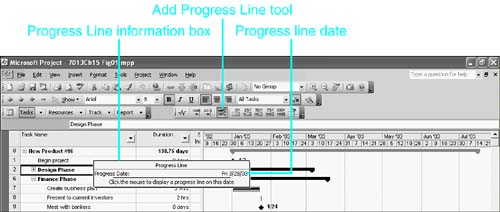
Using Progress LinesA progress line is a line that is drawn vertically down the Gantt Chart view on a particular date of interest. The date is usually the current date or the status date when tracking information was last updated. The progress line is intended to lead your eye quickly to tasks that are either behind or ahead of schedule. Figure 15.2 shows a progress line at the status date (3/13/03), and the spikes to the left draw your attention to tasks that have not been completed as scheduled as of the progress line date. The spikes to the right point to tasks for which work has been done ahead of schedule. Figure 15.2. The progress line indicates whether you are running behind schedule or have completed work ahead of schedule. The progress line is centered over the date that you select. The date can be the current date, the status date, or another specific date of interest to you. If a future or past task has started but not finished, the progress line connects to the point in its taskbar that represents the percentage complete for the task's duration. In the default Gantt Chart view, there is a black progress bar already drawn up to that point in the middle of the taskbar. If a task is scheduled for the past and has not started, its percentage complete is zero and the progress line connects to the task's start date. If the task is scheduled for the future and is complete, the progress line connects to the task's finish date (the end of its progress bar). The progress line ignores past tasks that are already completed and future tasks that have not started. Thus, the progress line peaks to the left to show tasks that are behind schedule as of the progress line date and peaks to the right to show tasks that are ahead of schedule. NOTE In order for progress lines to be drawn to future tasks that already have actual work, the option labeled Edits to Total Task % Complete Will Be Spread to the Status Date (which is found on the Calculation tab of the Options dialog box) must be enabled when you record the actual work for those tasks. Perhaps the most common progress bar is one that is drawn for the project's status date, as shown in Figure 15.2. To draw this progress line, you choose Tools, Tracking, Progress Lines to display the Progress Lines dialog box (see Figure 15.3). You can also right-click over the graphic area of the Gantt Chart view and choose Progress Lines from the shortcut menu. Select the check box labeled Always Display Current Progress Line, and then check the option At Project Status Date. By default, this special progress line displays in red on the Gantt Chart view. You can choose instead to display the current progress line at the current date. If you haven't defined the status date in the Project Information dialog box, Project uses the current date. Figure 15.3. The Progress Lines dialog box provides numerous options for controlling the placement and formatting of progress lines. To display a progress line on a specific date, select the Display Selected Progress Lines check box, enter the date in the Progress Line Dates list box, and click OK. You can display multiple progress lines by adding more dates to the list. To remove a date from the list, select it and press the Delete key or click the Delete button. To temporarily hide these progress lines, clear the Display Select Progress Lines check box. The date list remains, and you can redeploy those progress lines later by selecting the check box. You can also have Project display progress lines at regular intervals. To do this, you can use the options in the Display Progress Lines group to define how often the lines will occur (daily, weekly, or monthly) and exactly when, within each time unit, they will be drawn. By default, the recurring progress lines begin at the start of the project, but you can also define a different start date for the series of progress lines. Progress lines are usually drawn using dates in the current schedule. In the bottom-right corner of the Progress Lines dialog box, you can choose to use dates in the baseline schedule instead. The default is Actual Plan, which means you want to use the current schedule, including actual start and finish dates. If you choose Baseline Plan, Project draws the progress line to the date that represents the percentage complete, as applied to the baseline schedule. If the Gantt Chart view displays baseline bars, the progress line is drawn to the baseline bars. If it does not, the progress line is drawn to the calculated date anyway, even if that doesn't fall on a scheduled taskbar. TIP After you display a progress line, you can double-click anywhere on the progress line to display the Progress Lines dialog box to modify the display. The Line Styles tab on the Progress Lines dialog box provides numerous options for displaying progress lines. These display options give you a great degree of control over the types, colors, shapes , and date interval of progress lines. Figure 15.4 shows the Progress Lines dialog box with the Line Styles tab selected. Figure 15.4. The Line Styles tab in the Progress Lines dialog box allows you to format the look of progress lines.
Figure 15.5. The Progress Line information box displays the date on which the progress line will be placed. Filtering for Slipping Tasks
To apply the Slipping Tasks filter, choose Project, Filtered For, More Filters. Select the Slipping Tasks filter from the list and click Apply (or click Highlight to show all tasks but apply highlighting to those that are slipping). You can also select the filter from the Filter drop-down list on the Formatting toolbar. In a task view such as the Gantt Chart view, the Slipping Tasks filter shows which unfinished tasks are currently scheduled to finish after their baseline finish dates. If the baseline has not been captured for a task, that task will not be selected by the filter. If you apply the Slipping Tasks filter to the Task Usage view, Project selects resource assignments that are slipping, displaying both the slipping assignment and its task. This affords you the opportunity to zero in on the specific assignments that are causing a task to slip. Note, however, that the selection may include a task that is not slipping but has one or more resources whose assignments are slipping. That would happen only if the slipping assignments were scheduled to finish before the task finishes. You can apply a similar filter for resources, the Slipping Assignments filter, to the Resource Usage view to see slipping assignments grouped by resource. This view affords the opportunity to see whether some resources have a significantly larger number of slipping assignments than others. Armed with this information, you can investigate the causes and perhaps correct the problem.
Reviewing Status vis- -vis the Project PlanThe previous section describes ways to identify problems with tasks that have not or are not scheduled to finish on time. The Status and Status Indicator fields tell you only whether work is progressing as currently scheduledthey do not tell you if a project is progressing as defined in the baseline. This is also true for progress lines that are drawn to the scheduled dates. When you record actual progress, Microsoft Project recalculates the estimated final finish date, the total work, and the cost of the task and the project. The features described in the previous section do not help you identify changes in the total effect on tasks or the project. The following sections look at ways to examine the impact of schedule changes and actual performance on those estimates of final results. Defining VariancesYou can use a variety of tables, filters, views, and reports to quickly identify how a project's schedule is deviating from the baseline. Before we get into the analysis of progress, we need to take a look at how Project calculates and stores the information that we will use. For certain key measures (duration, work, cost, start date, and finish date) Project automatically calculates a variance when a difference occurs between the value in the current schedule and the value in the baseline. The variance fields are Duration Variance, Work Variance, Cost Variance, Start Variance, and Finish Variance. To the extent that values in the current schedule match those in the baseline, the variances will be zero. Changes in the schedule produce nonzero variances. To calculate a variance, Project takes the value in the current schedule and subtracts the baseline value, as follows :
NOTE If you fail to capture the baseline, the variances will be equal to the scheduled values. When the current schedule's value is greater than the baseline valuein other words, when the current schedule value is greater than plannedthe resulting variance will be a positive number. Positive variances are considered unfavorable; they mean that the current schedule calls for a longer duration, more work, more cost, and a later start or a later finish than the original plan, as recorded in the baseline. Conversely, negative variances are considered favorable because they mean that the current schedule calls for a shorter duration, less work, less cost, an earlier start, or an earlier finish than the baseline. Until you enter actual values to track progress on a task, the variances show the differences between the current estimated values of the schedule and the estimated values in the baseline. When you update the project by tracking actual progress, Project automatically replaces the estimated values of the current schedule with the actual values. Therefore, when actual values are entered, the variance fields show the difference between what actually happened and the original plan. Thus, if Task A actually starts on Monday, May 13, but it was originally scheduled to start on Monday, May 6, Project replaces the current estimated start date with the actual start date, and it calculates the start variance to be 5 working days. If Project didn't update the scheduled start date, it couldn't calculate the ripple effect that the delayed start will have on the start of other tasks that are successors to Task A. In addition to the variances, Project also calculates two fields that show the percentage complete for tasks: % Complete (which is the percentage of the duration that is complete) and % Work Complete (which is the percentage of work that is complete). Note that unlike the variance fields, these two fields compare actual and scheduled values, not scheduled and baseline values. It is important to understand the differences between these two fields because they give you two different perspectives on progress:
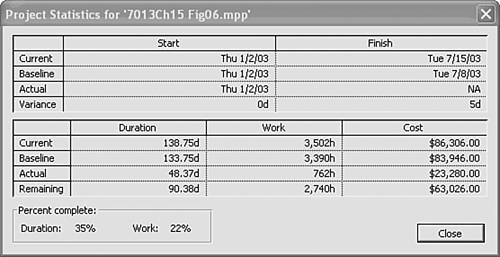
You might expect that these two percentages would always be equal, reasoning that if you've worked 40% of the time allotted to a task, then you should have completed 40% of the work. But the two measures can differ for a number of reasons. For example, a resource might actually work overtime while working 40% of the duration, thus doing more than 40% of the work. Or, one or more resources assigned to the task might have been scheduled with delayed start dates for their part of the task's work, thus scheduling more work per day in the final days of the task duration than in the beginning days. Reviewing Status at the Project LevelThere are several easy ways to get a quick overview of how an entire project is performing against the schedule and against the original plan. The Project Statistics dialog box and the Project Summary Report both display summary statistics for the overall project in one compact image. You can also display the project summary task in a view and use several predefined tables to see the same information. Displaying Project Statistics
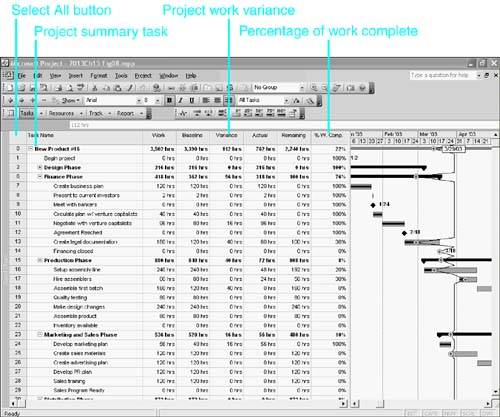
Figure 15.6. The Project Statistics dialog box shows a snapshot of the current plan versus the baseline plan. The Project Summary ReportSimilar to the Project Statistics dialog box, the Project Summary report displays an analysis of the current versus baseline plans for the entire project. In addition, it also includes the variances for duration, work, and cost. To preview the report choose View, Reports, and then double-click Overview and double-click Project Summary. Project shows a preview screen of the one-page report (see Figure 15.7), which you can review onscreen or send to a printer. Figure 15.7. Part of the Print Preview screen for the Project Summary report. Using The Project Summary TaskYou can see most of the same summary data that is shown in the Project Statistics dialog box and Project Summary report by displaying the project summary task in views that include tables. To display a project summary task, choose Tools, Options, and then select the View tab and select the check box next to Show Project Summary Task. The information in the first row of the summary summarizes the entire project. However, you have to apply different tables to see the full range of data that is displayed in the Project Statistics dialog box or the Project Summary report, and even then not all the statistics are included on the standard tables that are included in Project. For example, Duration Variance is not on any of the standard task tables, and to see that you would have to add the field to a table.
You can also create your own project summary task by inserting a task at the top of the project and indenting all other tasks beneath it. However, this method has drawbacks. The built-in project summary task does not alter the Work Breakdown Structure (WBS); Project assigns it the ID 0 while maintaining the numbering of the other tasks. In contrast, when you demote all other tasks to create a project summary task, the project summary is assigned the task ID 1. Not only would the WBS coding be burdened with an unnecessary level, but the filters and special analysis views that are discussed later in this chapter could give misleading results (as noted in the following sections). Furthermore, you lose the advantage of easily toggling the display of the summary task for printing and customization purposes. NOTE There is one very useful application for creating a project summary task. If you consolidate multiple projects in Project Standard in order to get an overview of progress for a project portfolio, the project summary task you create provides baseline information at the project level that Microsoft Project does not provide in the consolidated file. Without that project-level baseline information, you can't display the baseline schedule for the projects in the portfolio.
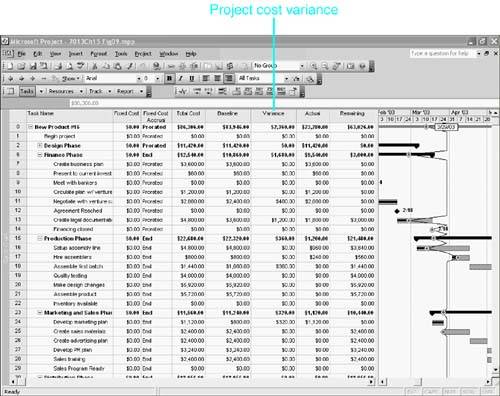
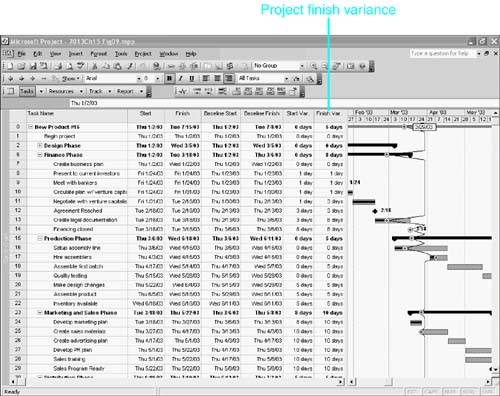
You can apply the Work table to review total project work, including the scheduled, baseline, variance, actual, remaining, and percentage of work complete values. To apply this table, you can right-click on the Select All button to display the Tables shortcut menu and then choose Work (see Figure 15.8). Figure 15.8. Work table values roll up to the project summary task. Figure 15.8 shows that the total work variance is 112 hours (which is unfavorable) and that 22% of the work is complete. You can use the Tables shortcut menu to apply the Cost table if you want to review a project's overall costs. Figure 15.9 shows the Cost Variance field for the project. The project summary task shows a total cost variance of $2,360.00 (which is unfavorable). The original estimated cost (baseline) was $83,946, but based on current progress, the project is expected to go over budget, with a total cost of $86,306. Figure 15.9. The project summary task shows total cost data for the project when the Cost table is applied. Just because a project has a favorable work variance doesn't mean that the project will finish on time. It's possible to be completing tasks according to the baseline work estimates but to still miss your targeted finish because tasks start or finish late. You can use the Tables shortcut menu to apply the Variance table if you want to see baseline and variance values for start and finish dates. In Figure 15.10, you can see that the project has a start variance of 0 but a finish variance of 5 days (which is unfavorable). This means that the project started as planned but is currently expected to finish 5 days behind the original schedule. Figure 15.10. Project variances are shown on the project summary task with the Variance table applied. TIP During the tracking process, you should consistently update actual start and actual finish dates for each task if they differ from the current schedule. When you enter an actual finish date that is later than originally estimated, there can be two important effects to note. First, if the total duration from actual start to actual finish is longer than the projected duration, Project will not only increase the total actual duration for the task but will also increase the actual work and actual cost (if you have not turned off the default calculation option Updating Task Status Updates Resource Status). Second, successor tasks will also be delayed. If the task that is being delayed is on the critical path, your project's overall finish date will likely be pushed to a later date.
CAUTION In most cases, you can also apply the Top Level Tasks filter to hide all tasks below Outline Level 1. However, if you have created a Summary task by inserting a task on Row 1 and demoted all other tasks beneath it, the "top level" tasks that you want to display will be at Outline Level 2. In that case, you should use the Show tool and select Outline Level 2. This is another reason to use the Show Project Summary Task option in the Options dialog box instead of manually demoting all tasks under a Summary task that you create.
Reviewing Status at the Task LevelIt's a good idea to plan to analyze variances in your schedule at least as often as you track progress. If you apply actual and remaining work on a weekly basis, you should plan to analyze variances on a weekly basis. It doesn't do much good to key in actuals every week and then not pay attention to what these numbers are telling you. Subtle increases of work and costs over the original baseline can add up quickly. The sooner you spot trouble and revise the plan, the more likely you are to achieve the project's objectives of on-time , on-budget completion.
Project provides a number of views, filters, and reports to assist you in spotting trouble at the task level of detail. Let's take a look at how you can analyze variances that are occurring on individual tasks in a plan.
If you have the Cost table displayed, you can click the AutoFilter drop-down list in the Variance column and choose > 0 (that is, greater than zero) from the list. If you are in the Work table or the Variance table, you have to create a custom filter to display only positive variances. To do this, select Custom from the AutoFilter drop-down list in the Variance column. Set the test to Is Greater Than, and set the value to 0 (that is, zero). Click OK to apply the filter. NOTE Note the test for positive values using AutoFilter assumes that the baseline was captured for all tasks. If the baseline was not captured, all the variances are positive, and the test is meaningless. Reviewing Task Start and Finish Date VariancesDate variances such as those shown for tasks in Figure 15.10 are created whenever the current start and finish estimates are different from the baseline dates. This can happen in a variety of ways:
If you record progress on a task by entering the percentage complete, Project automatically copies the scheduled (estimated) Start date to the Actual Start date. Project also inserts an Actual Start date if any Actual Work is entered for the task or for a resource assigned to the task. If you don't explicitly enter an actual start date, Project assumes that work started on the estimated start date. Thus, you might not see start date variances for a large number of the tasks in your project if you use these tracking methods . Applying similar logic to actual finish dates, Project automatically copies the estimated task finish date to the actual finish date when either the task percentage complete or the percentage work complete is set to 100%. Project also inserts an actual finish date when the remaining work or the remaining duration is set to zero. If you don't explicitly tell Project when the task actually finished, Project assumes that the task finished on the estimated finish date. When you determine that you have unfavorable date variances, it is important to trace their causes. Annotations to Notes or Comments fields can prove invaluable if the problem isn't fresh enough to recall. It's very important to devise corrective action to get the project back on schedule. The section "Revising a Schedule to Complete on Time and on Budget," later in this chapter, addresses that issue. Reviewing Task Cost VariancesUnfavorable cost variances are created whenever the current cost estimates are higher than the baseline cost estimates. Tasks can start and finish on time and complete within their original estimates and still have cost variances. For example, if you estimated that the programming would be completed with a Visual Basic for Applications (VBA) programmer at $50 per hour but you're forced to reassign the task to a programmer whose rate is $60 per hour , your costs will be overbudget, even if the hours remain constant. Hopefully, the programmer with the higher rate can complete the task in fewer hours than originally scheduled, but this will not always be the case. TIP Project does not take into account the competencies of resources available to the project, so assigning a different resource will not automatically shorten the duration of a task. Factoring this element into revising the duration for the task is often necessary for skill-based assignments. To spot problems with unfavorable costs, you can apply the Cost Overbudget filter. This filter looks for tasks that were baselined and that have a current estimated cost greater than the baseline cost (that is, the original estimate). To actually see the costs, you must apply the filter with the Cost table applied (as in Figure 15.9). TIP Because you likely will often use the Cost Overbudget filter with the Cost table, you might find it convenient to create a new view that always displays the Cost table with the Cost Overbudget filter. For information on designing views, see Chapter 21, "Customizing Views, Tables, Fields, Filters, and Groups." Reviewing Task Work VariancesWork variances are calculated for each task by subtracting the task's baseline work from the currently scheduled work. A negative work variance is favorable because it means that the currently scheduled work is less than originally planned. In contrast, a positive work variance is unfavorable because it means that to complete the task, resources must expend more work than originally estimated. The fastest way to see the work variances for each task in a plan is to apply the Work table (as in Figure 15.8). The Variance column displays the work variances for each task in the plan. To focus on trouble spots, you should look at tasks that have unfavorable work variances. Project provides a filter called Work Overbudget that should behave like the Cost Over budget filter discussed earlierit should select tasks with work estimates that are larger in the current schedule than in the baseline. However, the Work Overbudget filter uses the field Actual Work instead of Work in its comparison with the Baseline Work field. Therefore, it doesn't include tasks that have yet to start but have unfavorable work variances. You can redefine the filter by using the following steps:
Reviewing Status at the Resource LevelIn addition to analyzing progress and variances for tasks, you can analyze progress and variances for resources. The concept is very similar to many of the analyses performed on tasks in the preceding section. Project saves baseline date, work, and cost values for each assignment. The baseline assignment values for work and cost are rolled up to the task level and to the resource level. Thus, the baseline work and cost for a resource are the total baseline values for all that resource's assignments, just as the resource's scheduled work and cost and actual work and cost are the totals for all its assignments. A resource's work and cost variances compare these rolled-up scheduled and baseline totals. By analyzing resource variances, you might determine that the reasons for task variances are related to specific resources, as in the following examples:
Rather than repeat the steps that you performed on tasks for work, date, and cost variances in the preceding section, Table 15.2 shows the tables and filters you can select to show useful resource variances. You can apply these to the Resource Sheet view to simply identify resource names that are selected by the filters. However, to see which assignments contribute to resource variances, you need to display the Resource Usage view. Table 15.2. Suggested Variance Analyses from Tables Applied to the Resource Usage View
Reviewing Status at the Assignment LevelAs discussed in the preceding section, the baseline assignment values for work and cost are rolled up to the resource and task levels. To see the assignment details, you must display either the Task Usage view or the Resource Usage view. You can see work and cost variances at the assignment level in either the Task Usage view or the Resource Usage view (see the preceding section). However, resources do not have baseline start or finish fields, so there are no start and finish variances for resources, either. You must display the Task Usage view to see start and finish variances at the assignment level. To display tasks and assignments, you can select View, Task Usage. Then, you can display the Work, Cost, or Variance tables to see assignment variances in the table on the left. To see timephased baseline work values for each assignment, you can right-click on the grid, under the timescale, and choose Baseline Work from the shortcut menu. (You might need to widen the column of row labels in the grid by dragging the right boundary of the Detail cell in the timescale .) Figure 15.11 shows the Task Usage view with the Cost table on the left and the Work and Baseline Work details displayed in the grid on the right. Both Bill Kirk and Scott Adams were assigned to the Prototype Design task. Bill finished his assignment with 12 fewer hours of work than planned, and he had a favorable cost variance of $240. Scott, on the other hand, was not finished with his assignment as the end of the task neared, so he worked on the assignment 8 hours instead of the planned 4 hours for each of the last 3 days. Scott has an unfavorable cost variance of $240. The two assignment variances offset each other in this case, and the task variance is 0. Figure 15.11. The Task Usage view shows assignment details for scheduled work to baseline work at the resource assignment level. If you display the Cost table, you can see cost variances by assignment. To display cost details in the grid, you can right-click over the grid and choose Cost from the shortcut menu. To display timephased baseline cost, you can right-click over the grid and choose Detail Styles from the shortcut menu. In the Detail Styles dialog box, select Baseline Cost in the list on the left and click the Show button. If you want Baseline Cost to always be available on the shortcut menu, select the Show in Menu check box at the bottom. Then click OK to return to the Task Usage view. |
 For more information on customizing filters,
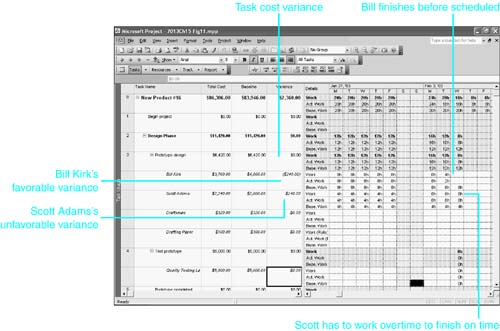
| < Day Day Up > |
EAN: 2147483647
Pages: 283