22.3 What is the Wait Event Interface?
|
| < Day Day Up > |
|
The Wait Event Interface is a group of Oracle Database performance views allowing drilling down into various areas of activity occurring in an Oracle Database installation. These activities are either summarized from the most recent database startup or maintained for the life of each session. The simplest way to present those views and their inter-related structure is to present them in steps. It should also be noted that drilling into wait events includes waits not only on events but deeper layers such as latches and others.
| Note | Oracle Database 10 Grid Numerous Wait Event Model changes are made including changes to various V$ performance views along with a number of additional V$ performance views. |
Firstly, Figure 22.1 shows a brief picture of various tools which can be used to drill down into wait events. These tools can be used to allow easy access to underlying Oracle Database performance views. In this book, I want to start by explaining the lowest level of application of the wait event interface using the performance views. Simply displaying how to use various tools or describing their output does not help to provide better understanding. When it comes to examples Oracle Enterprise Manager will be used to drill down into wait events as they occur. STATSPACK will be used to compare two different points in time for a database.
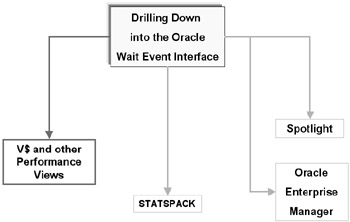
Figure 22.1: Tools for Drilling into the Oracle Database Wait Event Interface
I like to divide the Wait Event Interface performance views into three sections: the system aggregation layer, the session layer followed by the third layer, and beyond. The first I call the "system aggregation" layer because in its simplest form it contains a record of statistics collected by what I like to call the "session layer". The session layer contains statistics about sessions during the life of those sessions. There is a deeper layer of the Wait Event Interface involving hooks through to many other performance views. I like to call this deeper layer the "crazy about V$ views" layer or "the third layer and beyond". This third layer will not be examined in detail but described briefly and then displayed by example using Oracle Enterprise Manager. There is too much complexity in the third layer to go into every detail. It is not worth explaining every nitty-gritty piece, possibly boring my readers to tears.
22.3.1 The System Aggregation Layer
A brief overview of the system aggregation layer of the Wait Event Interface is shown in Figure 22.2. The V$EVENT_NAME view gives a list of all possible events. The V$SYSTEM_EVENT view contains an aggregation of existing wait events and total wait times for each. V$SYSTEM_EVENT view is cleared on database restart.
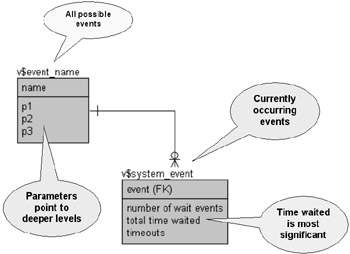
Figure 22.2: The System Aggregation Layer of the Oracle Database Wait Event Interface
| Tip | The TIMED_STATISTICS parameter must be set to TRUE for V$SYSTEM_EVENT to contain information. Setting the TIMED_STATISTICS parameter has minimum performance impact. |
The V$SYSTEM_EVENT view can be joined to the V$EVENT_ NAME view using the EVENT and NAME columns, respectively, as shown in Figure 22.2.
The V$EVENT_NAME view has information about hooks to drill down into the third layer, mentioned above, of potential bottleneck problems using the parameter columns: PARAMETER1, PARAMETER2, and PARAMETER3. These parameter columns contain information as to what event parameters in third-layer views such as the V$LATCH view will be pointed to from the V$SESSION_WAIT view.
| Tip | V$EVENT_NAME view parameter columns do not contain actual values, only descriptions of what values are. The parameter values are contained in the session layer in the V$SESSION_WAIT performance view. |
Some of the values in the V$EVENT_NAME view parameter columns are as shown. There are a lot of them.
SELECT DISTINCT(parameter1) FROM v$event_name WHERE parameter1 LIKE '%#%'; PARAMETER1 -------------------------------------------- block# branch# buffer# by thread# circuit# copy latch # end-point# event # file# log# segment# session# thread# undo seg#|slot# undo segment# SELECT DISTINCT(parameter2) FROM v$event_name WHERE parameter2 LIKE '%#%'; PARAMETER2 -------------------------------------------- #bytes block# chain# our thread# process# wrap# SELECT DISTINCT(parameter3) FROM v$event_name WHERE parameter3 LIKE '%#%'; PARAMETER3 -------------------------------------------- process# set-id#
For instance, the combination of file# in PARAMETER1 and block# in PARAMETER2 can be used to drill down into extents to find an offending segment, a table in others words. The diagram shown in Figure 22.2 is appropriately adjusted in Figure 22.3.
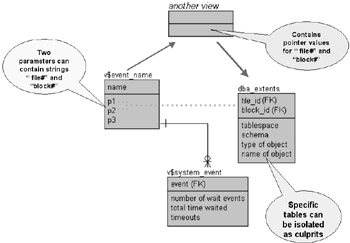
Figure 22.3: Isolating Segments using Event Parameters
This query shows how to join the various views for existing wait events and will not be executed in this chapter. A demonstration later on using Oracle Enterprise Manager will suffice.
SELECT de.segment_name, sw.event FROM dba_extents de, ( SELECT sw.event, sw.p1 AS file_id, sw.p2 AS block_id FROM v$session_wait sw WHERE IdleEvent(event) IS NOT NULL AND sw.sid IN (SELECT sid FROM v$session WHERE username = 'ACCOUNTS') AND sw.event != 'null event') sw WHERE de.owner = 'ACCOUNTS' AND de.file_id = sw.file_id AND de.block_id = sw.block_id;
Examining the DBA_EXTENTS view in detail from this perspective we can see the different segment types.
SELECT DISTINCT(segment_type) FROM dba_extents; SEGMENT_TYPE -------------------------------------------- CACHE CLUSTER INDEX INDEX PARTITION LOBINDEX LOBSEGMENT NESTED TABLE ROLLBACK TABLE TABLE PARTITION TYPE2 UNDO
From another perspective we can see table and index names.
SELECT DISTINCT(segment_name) FROM dba_extents WHERE segment_type IN ('TABLE','INDEX') AND owner = 'ACCOUNTS'; SEGMENT_NAME -------------------------------------------- AK_GL_DTE AK_SP_ZIP AUDITSIM CASHBOOK CASHBOOKLINE CATEGORY COA CUSTOMER GENERALLEDGER ORDERS ORDERSLINE PERIOD PERIODSUM PLAN_TABLE POSTING … So we should be able to see from the various queries already shown that potential wait event issues can be isolated to specific objects in the database. Let's look at some details. Firstly, let's list the top currently occurring wait events. Throughout this final chapter of Part III on physical performance tuning, I use queries used in previous chapters or slightly modified versions thereof, only in this chapter with a more specific objective in mind. Previous chapters in Part III mostly describe architecture and configuration. This chapter attempts to find and solve existing problems.
COL event FORMAT a32; COL percentage FORMAT 9999999990; SELECT * FROM( SELECT event "Event", total_waits "Waits", time_waited "Total Time" ,TO_CHAR( (time_waited / (SELECT SUM(time_waited) FROM v$system_event WHERE IdleEvent(event) IS NOT NULL) )*100, 990.99) "Percentage" FROM v$system_event WHERE IdleEvent(event) IS NOT NULL ORDER BY 3 DESC) WHERE ROWNUM <= 10;
These are my top 10 wait events based on the total amount of time the system spends waiting for each event. The only thing to decide at this point is what is a significant event. Which event in this list is the most significant and can have the most profound effect on performance? Some knowledge of applications might be required at this stage because high incidence of some wait events could be normal and thus acceptable, depending on applications.
Event Waits Total Time Percent ------------------------------ ------ ---------- ------- db file sequential read 623840 7542616 71.59 buffer busy waits 259455 2330819 22.12 enqueue 1944 566381 5.38 latch free 3996 49586 0.47 control file parallel write 4956 21016 0.20 db file parallel write 1102 7472 0.07 library cache pin 112 6666 0.06 control file sequential read 2156 6371 0.06 log file parallel write 1559 1621 0.02 library cache load lock 8 714 0.01
The real problem with the preceding query is that the information obtained is a little too vague at this point. The db file sequential read event could indicate hot block issues but could also be normal. The same applies to buffer busy waits. The enqueue, latch free and wait events in the library cache could have more significant impact on performance.
22.3.2 The Session Layer
The session layer uses various performance views such as V$SESSION_ EVENT and V$SESSION_WAIT. These session views only contain information for a session as long as that session exists and are shown in Figure 22.4.
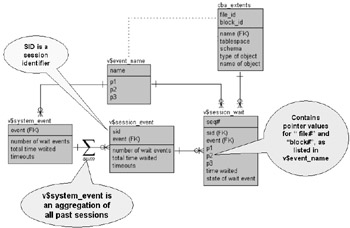
Figure 22.4: Session-Level Event and Wait Views
| Tip | The V$SYSTEM_EVENT view contains an accumulated aggregation or summation of values in the V$SESSION_EVENT view, aggregated on termination of a session. |
It is important to stress that using session-level performance views only finds wait events as they occur. If sessions are application- controlled or connections are shared then using session-level wait event detection may be awkward to decipher without deeper analysis.
| Tip | Snapshots may have to be taken over specified time periods such as is possible using STATSPACK. |
Since continual connecting and disconnecting, common to client– server systems, usually does not occur in OLTP database environments, sessions are often shared between connections in one form or another. The net result is that the specific nature of session-level wait event tracking can become somewhat blurred and possibly less useful, and perhaps even more akin to that of system-level event tracking. Session-level wait event detection may often be more appropriate to tracking down bad SQL code executed in ad hoc environments. Ad hoc SQL code is rare in mission critical OLTP-type databases. Most OLTP databases are controlled by applications.
The V$SESSION_EVENT performance view provides wait events for sessions for the entire life of the session. The V$SESSION_WAIT performance view provides the same information but as the wait events are occurring, also with access to deeper layers using parameter pointer values as shown in Figure 22.4. The V$SESSION_ EVENT view is effectively an accumulation of wait events for sessions during the life of those sessions. Thus V$SESSION_EVENT could be used to isolate sessions causing specific problems. Here are the worst 10 events by session.
COL event FORMAT a32; SELECT * FROM ( SELECT sid, event, total_waits "Waits", time_waited "Total Time" FROM v$session_event WHERE IdleEvent(event) IS NOT NULL ORDER BY 4 DESC) WHERE ROWNUM <= 10; SID EVENT Waits Total Time --- --------------------------- ----- ---------- 50 db file sequential read 8826 91390 4 db file sequential read 3204 33929 17 enqueue 94 28399 19 enqueue 94 28398 25 enqueue 93 28255 35 db file sequential read 6791 28112 40 buffer busy waits 3857 21593 45 buffer busy waits 3811 21338 3 control file parallel write 2383 20054 37 db file sequential read 1493 17461
This query shows events causing the highest wait times, more significant than those occurring most frequently. The most frequently occurring events would be found by summing the number of waits.
COL event FORMAT a32; SELECT * FROM ( SELECT event, SUM(time_waited) "Total Time" FROM v$session_event WHERE IdleEvent(event) IS NOT NULL GROUP BY event ORDER BY 2 DESC) WHERE ROWNUM <= 10; EVENT Total Time ---------------------------- ---------- db file sequential read 489236 enqueue 360328 buffer busy waits 292884 control file parallel write 20653 db file parallel write 10501 control file sequential read 6169 latch free 3959 log file parallel write 2306 LGWR wait for redo copy 165 log file sequential read 52
Examining the V$SESSION_WAIT performance view will not only show wait events as they occur but allow us to use parameter value pointers to find specific details such as database objects as shown in the DBA_EXTENTS view query previously in this chapter. An accumulation on the V$SESSION_WAIT view is useful to get a better overall picture as shown by using the anonymous procedure following.
| Tip | This type of cumulative processing can be performed easily using a tool such as STATSPACK. At this stage the objective is to explain and teach the basics rather than the syntax of a tool such as STATSPACK. |
In this procedure let's try to find offending segments by using the file# and block# pointers as found in the V$EVENT_NAME view.
DROP TABLE tmp; CREATE TABLE tmp (sid NUMBER, event VARCHAR2(64), file_id NUMBER, block_id NUMBER, wait_time NUMBER, seconds_in_wait NUMBER); BEGIN FOR counter IN 1..1000 LOOP INSERT INTO tmp SELECT sw.sid, sw.event AS event, sw.p1 AS file_id, sw.p2 AS block_id, sw.wait_time, sw.seconds_in_wait FROM v$session_wait sw WHERE IdleEvent(sw.event) IS NOT NULL AND sw.event IN (SELECT name FROM v$event_name WHERE parameter1 = 'file#' AND parameter2 = 'block#'); COMMIT; END LOOP; END; / COL event FORMAT a32; SELECT * FROM ( SELECT sid, event, SUM(seconds_in_wait) "Current Wait Time" FROM tmp WHERE IdleEvent(event) IS NOT NULL GROUP BY sid, event ORDER BY 2 DESC) WHERE ROWNUM <= 10; EVENT Current Wait Time ---------------------------- ----------------- db file sequential read 2670 buffer busy waits 617 db file sequential read 163 buffer busy waits 43 control file sequential read 0
Now let's take a step back and try to find the worst-performing sessions in the V$SESSION_EVENT view.
COL event FORMAT a32; SELECT * FROM ( SELECT sid, SUM(time_waited) "Total Time" FROM v$session_event WHERE IdleEvent(event) IS NOT NULL GROUP BY sid ORDER BY 2 DESC) WHERE ROWNUM <= 10; SID Total Time --- ---------- 50 124491 17 54034 19 54027 25 52969 40 52958 45 52933 4 41486 35 40264 41 34010 29 33403
That query does not really tell me much. What is session identifier (SID) 50? We can find more information about SID 50 using the V$SESSION performance view. The real value of the session-level part of the Wait Event Interface, other than searching for offending database objects in the DBA_EXTENTS view, is the way in which the session identifier can be connected to sessions in the V$SESSION view and ultimately to other views including SQL code and Optimizer query execution plans. Figure 22.5 shows the drill-down path of session-level executed SQL code and query plans. One of the primary factors causing database performance problems is poorly built SQL code.
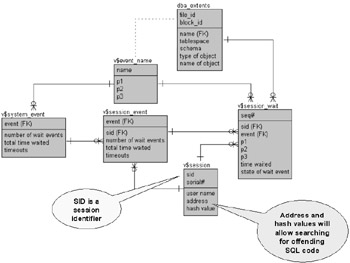
Figure 22.5: Hooking Wait Events to Sessions
| Tip | Sometimes data model problems can be isolated as a result of finding poorly performing SQL code. |
So we could find the usernames (schemas) of offending sessions by joining the V$SESSION_EVENT or V$SESSION_WAIT views with the V$SESSION performance view.
COL event FORMAT a32; SELECT * FROM ( SELECT s.username, SUM(se.time_waited) "Total Time" FROM v$session_event se, v$session s WHERE IdleEvent(se.event) IS NOT NULL GROUP BY s.username ORDER BY 2 DESC) WHERE ROWNUM <= 10; USERNAME Total Time -------- ---------- ACCOUNTS 69680468 24120162 SYS 5360036
Now let's add some of the various SQL code views as shown in Figure 22.6.
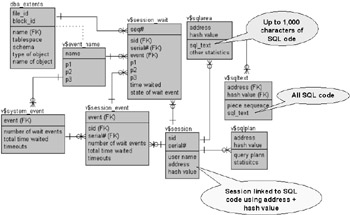
Figure 22.6: Find SQL Code for Sessions
The following query simply joins sessions and SQL code statements to find SQL code which is currently executing the most often.
SELECT * FROM (SELECT s.username, a.sql_text, a.executions FROM v$session s, v$sqlarea a WHERE s.sql_address = a.address AND s.sql_hash_value = a.hash_value ORDER BY 3 DESC) WHERE ROWNUM <= 10; USERNAME SQL_TEXT -------- ----------------------------------------------------- SELECT to_number(to_char(SYSTIMESTAMP,'FF3'))+1 from dual SELECT to_number(to_char(SYSTIMESTAMP,'FF3'))+1 from dual ACCOUNTS INSERT into transactions values (transactions_seq.nextval,'S' ACCOUNTS INSERT into transactions values (transactions_seq.nextval,'S' ACCOUNTS INSERT into transactions values (transactions_seq.nextval,'S' ACCOUNTS INSERT into transactions values (transactions_seq.nextval,'S' ACCOUNTS INSERT into transactions values (transactions_seq.nextval,'S' ACCOUNTS SELECT min(order_id),max(order_id) from orders ACCOUNTS SELECT min(order_id),max(order_id) from orders ACCOUNTS SELECT min(order_id),max(order_id) from orders
Similar join queries can be used to access both entire SQL code statements from the V$SQLTEXT view and stored query execution plans from the V$SQL_PLAN view, joined using the ADDRESS and HASH_VALUE columns.
22.3.3 The Third Layer and Beyond
From examination of the system aggregation and session layers you should have noticed two general paths of drill down which can be followed. Firstly, drilling into the parameters allows access to details about events and why they are causing issues. Secondly, SQL code can be accessed directly using address and hash values. These two wait event drill down access paths can be joined together because the SQL views are linked to a session and a session is linked to session wait events in the V$SESSION_WAIT performance view.
Let's take a look at a specific example of drilling down into the third layer before we go on to showing how Oracle Enterprise Manager does all this stuff! Let's take a look at latch free wait events. Figure 22.7 shows a pseudo-type structure for latch V$ performance views. There are numerous views but we will simply look at the topmost part of the third layer, for latches only.
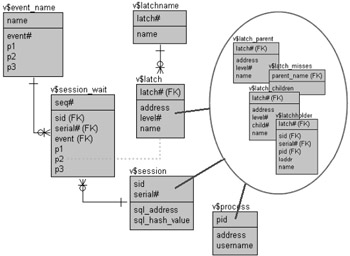
Figure 22.7: Drilling Down into Latches
For latch free wait events the LATCH# column on the V$LATCHNAME view is contained in the PARAMETER2 column of the V$SESSION_WAIT view, allowing direct or indirect drill down access into all the various latch performance views. Let's take a look at current latch wait problems in order to demonstrate parameter level drill down into the third layer of the Oracle Database Wait Event Interface.
First check the parameter values.
SELECT parameter1||' '||parameter2||' '||parameter3 FROM v$event_name WHERE name = 'latch free'; PARAMETER1||''||PARAMETER2||''||PARAMETER3 -------------------------------------------- address number tries
PARAMETER2 contains a latch number, the equivalent of the LATCH# column in the V$LATCH performance view. The following query will not really tell us much but it joins the V$LATCH and V$SESSION_WAIT performance views.
SELECT sw.sid, sw.event, sw.wait_time, sw.seconds_in_wait ,l.name, l.gets, l.misses, l.sleeps FROM v$session_wait sw, v$latch l WHERE sw.p2 = l.latch#;
We could quite obviously drill into the latches further as can be seen in Figure 22.7, linking through to sessions, processes, SQL code, query execution plans, and so on. The point to make now is as follows. There is a much easier way of drilling down into the Oracle Database Wait Event Interface, using Oracle Enterprise Manager. Similar functionality is available in Spotlight and STATSPACK. However, I think that Oracle Enterprise Manager is a better tool for Wait Event Interface drill down. That has not always been the case. Before we go on to using Oracle Enterprise Manager to drill down into the Oracle Database Wait Event Interface we should digress a little.
|
| < Day Day Up > |
|
EAN: 2147483647
Pages: 164