Working with PRM
| You can work with PRM at the command line or through the xprm graphical interface. We'll start with command-line work in our examples because you learn more about the application at the command line than at the graphical interface. We'll then show the results of our command-line work in the graphical interface. Table 18-1 includes a brief description of PRM- related commands and some files of interest. There is much more detail on these commands and files in the User 's Guide . Table 18-1. PRM Command Summary and Files
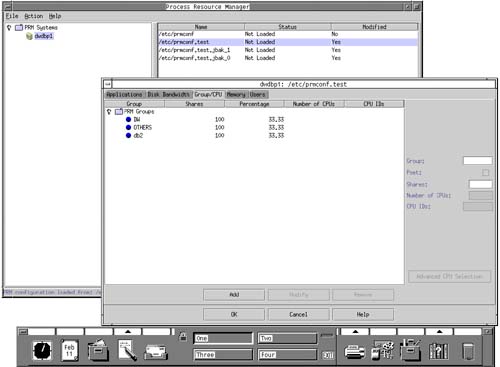
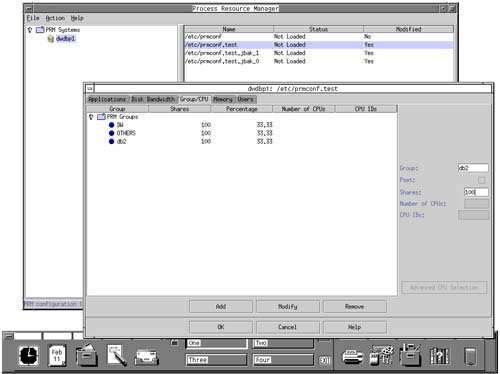
We'll use some of these commands and files in our upcoming examples. The key file to configuring PRM is /etc/prmconf . This file defines PRM groups and how you want resources controlled. You would typically configure this file to meet your needs. You could either update the file or a copy of it. You can also modify this file or a copy of it using xprm . After making modifications to the file you would check and load the configuration file with prmconfig . You can confirm that the processes are running in the correct PRM groups with ps -efP . If you are running accounting on your system you can use prmanalyze to scan accounting files and produce reports about various system resources. After you have modified /etc/prmconf you can use GlancePlus/UX to view the resources consumed by PRM groups and confirm that the configuration you have put in place meets your needs. Figure 18-1 shows the high-level steps you might perform when working with PRM. Figure 18-1. Possible PRM Steps You might perform only some of these steps and add others that are not shown in the figure depending on your needs and your environment. These are only some recommended PRM-related steps. The following listing shows the default /etc/prmconf file automatically produced on a system: root@dwdbp1[/.root] > cat /etc/prmconf # # # # Group/CPU records # DW:2:100:: OTHERS:1:100:: # # Memory records # # # Application records # # # Disk bandwidth records # # # User records # adm::::OTHERS bin::::OTHERS daemon::::OTHERS hpdb::::OTHERS lp::::OTHERS nobody::::OTHERS nuucp::::OTHERS opc_op::::OTHERS smbnull::::OTHERS sys::::OTHERS uucp::::OTHERS webadmin::::OTHERS www::::OTHERS root@dwdbp1[/.root] > root@dwdbp1[/.root] > This file has in it only the two PRM groups DW and OTHERS . In this file you'll typically produce your own list of PRM groups and define the amount of resources each group can consume when the system is heavily loaded. You can control a group's CPU, memory, and disk resources. PRM groups are assigned on a per-process basis and are not related to UNIX group assignments such as those in /etc/group . The PRM groups use the Fair Share Scheduler (FSS) to obtain the amount of overall system resources you have defined for a given group. Alternatively you could define groups on a Processor Set (PSET) basis, meaning that the group will obtain processor resources based on a subset of the server's total processors in the PSET. The examples in this chapter use the FSS method. The resources defined by each group are in the form of shares. Resource shares are the minimum amount of resources assigned to PRM groups when the system is at peak load. You don't care about these shares at times other than peak load unless you are using resource caps. One of the upcoming sections in this chapter covers resource caps which are enforced all of the time, even if the system is not at peak load. When you allocate shares to a PRM group they are converted to percentages of system resources. Figure 18-2 shows two examples of shares and the corresponding percentages: Figure 18-2. Share and Percentage Examples The top example in Figure 18-2 shows a total of four groups. The PRM_SYS group is automatically created for you and assigned system resources. You can manually add it to the configuration file and assign its share if you wish or just let PRM handle it automatically. PRM_SYS has PRMID . The OTHERS group has in it all users in /etc/passwd by default. OTHERS has a PRMID of 1 . You can assign users to PRM groups in /etc/prmconf as you see fit. Although all /etc/passwd users go into OTHERS by default, you can list the users and their PRM group in /etc/prmconf . PRM groups have the following syntax for each record: GPOUP:{ PRMID HIER PSET }:SHARES::[[CPUS] : [CPU_LIST] In the upcoming capping example we created the following record for user db_hp to place her in the PRM group db2 . Then there is a record for the PRM group db2 showing its ID and share: root@dwdbp1[/etc] > cat prmconf.test # # # # Group/CPU records # DW:2:100:: OTHERS:1:100:: db2:3:100:: # # Memory records # # # Application records # # # Disk bandwidth records # # # User records # db_hp::::db2 adm::::OTHERS bin::::OTHERS daemon::::OTHERS hpdb::::OTHERS lp::::OTHERS nobody::::OTHERS nuucp::::OTHERS opc_op::::OTHERS smbnull::::OTHERS sys::::OTHERS uucp::::OTHERS webadmin::::OTHERS www::::OTHERS root@dwdbp1[/etc] > The PRM group db2 has a PRMID of 3 and a share of 100 in this example. There is one user in the group db2 with a name db_hp . The prmconf file is easy to modify to meet your PRM needs. You can also use xprm to view and change PRM configuration information as shown in Figure 18-3: Figure 18-3. xprm and Configuration Data prm1.bmp This xprm window has several tabs across the top that are used to control various aspects of the PRM configuration file we have loaded. The Group/CPU tab is selected in this screen shot. Notice that the three groups have an equal share of 100, which gives them each one third of the overall system resources. The 100 share was shown in the earlier prmconf.test listing. You can adjust these shares and any aspect of the groups through the xprm interface. When assigning your groups and shares, it is useful to know the amount of resources you have at your disposal to assign to PRM groups. The following shows the output of the prmavail command: # prmavail 4 CPUs 846200 real memory pages or 3305 MB available (PRM estimate) 9 volume groups /dev/vg00 /dev/vgmti1 /dev/vgmti2 /dev/vgmti3 /dev/vgmti4 /dev/vgmti5 /dev/vgmti6 /dev/vgmti7 /dev/vgmti8 This output shows a Superdome hard partition that has the CPUs, memory, and volumes available for use. Now that we've covered many of the basics related to PRM, let's jump into a couple of examples of using PRM. The first example implements capping of system resources regardless of whether the system is at peak load or not. The second example limits resources at the time of peak load. This is the mostly widely used implementation of PRM. Manual (non-GUI) Setup of PRM with Resource CapsYou can cap the amount of system resources a given user or group of users consumes with PRM. In this example we have a group of Oracle users on a system. We're about to add a second group of non-Oracle users to the system so we want to cap the amount of CPU resources each group of users can consume. This is done because we don't want one group to become accustomed to unlimited resources and then add additional groups that degrade performance. The setup we perform is the same whether or not caps are used. We simply enable caps if we want them employed or disable caps if we don't want to use them. This section of the chapter focuses on manual PRM configuration. The existing users are put into one PRM group and new users are put into a second group. In our example the second group will have only one user in it in order to keep it simple. Our example is a proof-of-concept to show that the resources that our new user consumes can be limited regardless of the overall loading on the system. We'll do the following in this example:
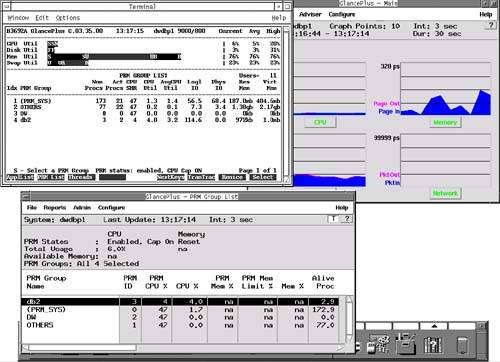
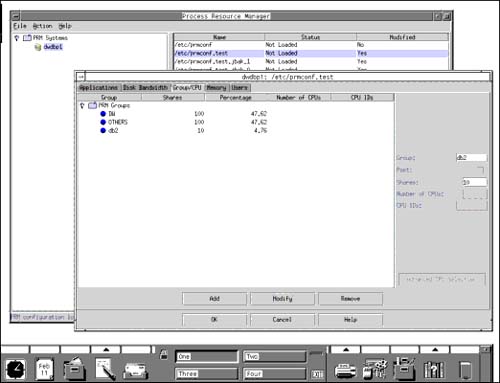
This is a good PRM example because it clearly demonstrates the dramatic effect that lowering the share has on system resources and the time required to complete the job. When we loaded and configured PRM, all of the existing users in /etc/passwd were put into the default PRM group of OTHERS . We then created a new user called db_hp and placed this user in its own PRM group called db2 . Initially, all of the PRM groups had an equal share of 100 for system resources. The following is the /etc/prmconf listing, showing all PRM-related information: ++++++++++++++++++++++++ # # # # Group/CPU records # DW:2:100:: <-- Group of OTHERS, share of 100 OTHERS:1:100:: <-- Default group of OTHERS, share of 100 db2:3:100:: <-- Group db2 with one user, share of 100 # # Memory records # # # Application records # # # Disk bandwidth records # # # User records # db_hp::::db2 adm::::OTHERS bin::::OTHERS daemon::::OTHERS hpdb::::OTHERS lp::::OTHERS nobody::::OTHERS nuucp::::OTHERS opc_op::::OTHERS smbnull::::OTHERS sys::::OTHERS uucp::::OTHERS webadmin::::OTHERS www::::OTHERS User db_hp in PRM group db2 will now run a job that consumes a substantial amount of system resources. Figure 18-4 shows a GlancePlus screen shot of the PRM groups and the amount of resources they are consuming using the PRM List tab, which is F2 : Figure 18-4. HP GlancePlus/UX Showing PRM Group System Resources. Notice that all of the PRM groups have been allocated an equal amount of system resources, based on the share definitions of 100 , which is reflected in the GlancePlus screen shot as a percentage of CPU. The job that PRM Group db2 is running can't consume more than its maximum allocated cap of CPU resources even though the system is not heavily loaded and additional resources are available. At the time this screen shot was produced, PRM group db2 was consuming its maximum of 25% system resources even though only 26% of the CPU was in use. db2 would like to consume more system resources, but its cap is enforced, limiting it to 25%. Note also that the first PRM group (PRM_SYS) was not in the active PRM configuration file /etc/prmconf.test . This PRM group is produced by default. Not shown in the PRM List screen is that this is a four-processor server (this is shown in the CPU Rpt screen). This server is a hard partition (nPartition) of a Superdome system. It is, for all intents and purposes, a separate server even though it is in the same Superdome complex as several other nPartitions. The percentages of CPU resources shown in this example use all four processors and the FSS scheduling method. We can confirm the number of processors, and other resources available to us, with the prmavail command as shown below: # prmavail 4 CPUs 846200 real memory pages or 3305 MB available (PRM estimate) 9 volume groups /dev/vg00 /dev/vgmti1 /dev/vgmti2 /dev/vgmti3 /dev/vgmti4 /dev/vgmti5 /dev/vgmti6 /dev/vgmti7 /dev/vgmti8 This output shows a Superdome hard partition that has the CPUs, memory, and volumes available for use. The time command was run to see the amount of time the job would take to complete with a share of 100, as shown in the following output: $ time /tmp/job real 44.5 user 7.7 sys 35.6 $ This job took 44.5 seconds to complete with its share of 100 and maximum system resources cap of 25% . The following listing shows running the ps -efP command to view the PRM groups in which processes are running: $ ps -efP real 44.5 user 7.7 sys 35.6 $ We'll now reduce the share for PRM group db2 from 100 to 10 in the active PRM configuration file /etc/prmconf.test to see how this affects the running of the job. After editing the file and reducing the share of db2 from 100 to 10, we'll run the prmconfig command shown below: # prmconfig -i -f /etc/prmconf.test PRM configured from file: /etc/prmconf.test File last modified: Mon Feb 11 12:43:01 2002 PRM CPU scheduler state: Enabled, CPU cap ON PRM Group PRMID CPU Entitlement ------------------------------------------------------- DW 2 47.62% OTHERS 1 47.62% db2 3 4.76% PRM memory manager state: Not Running PRM User Initial Group Alternate Group(s) -------------------------------------------------------------------- adm OTHERS bin OTHERS daemon OTHERS db_hp db2 hpdb OTHERS lp OTHERS nobody OTHERS nuucp OTHERS opc_op OTHERS root (PRM_SYS) smbnull OTHERS sys OTHERS uucp OTHERS webadmin OTHERS www OTHERS PRM application manager state: Enabled (polling interval: 30 seconds) PRM application manager logging state: Disabled Disk manager state: Disabled # The -i option creates the PRM groups and moves all currently running applications and user processes into their assigned groups. In our case the modification to the shares also takes effect. The -f option specifies that the configuration file /etc/prmconf.test is to be used. The default configuration file /etc/prmconf is used if -f and the configuration file are not specified. The previous output shows that the percentage of system resources that db2 can use has dropped commensurate with the reduction in its share. We can also run prmlist to see the PRM group-related information, as shown in the following listing: # prmlist PRM configured from file: /etc/prmconf.test File last modified: Mon Feb 11 12:43:01 2002 PRM Group PRMID CPU Entitlement ------------------------------------------------------- DW 2 47.62% OTHERS 1 47.62% db2 3 4.76% PRM User Initial Group Alternate Group(s) ----------------------------------------------------------------------- adm OTHERS bin OTHERS daemon OTHERS db_hp db2 hpdb OTHERS lp OTHERS nobody OTHERS nuucp OTHERS opc_op OTHERS root (PRM_SYS) smbnull OTHERS sys OTHERS uucp OTHERS webadmin OTHERS www OTHERS The prmlist output reflects the information that we had put in the configuration file. Figure 18-5 shows the new percentages in the GlancePlus screen and the much lower cap on system resources. Figure 18-5. HP GlancePlus/UX Showing Reduced db2 Resources Figure 18-5 shows that a lot of system resources are available; however, our cap of 10 share greatly reduces the percentage of CPU resources PRM group db2 can consume. The change of share and percentage of CPU for the PRM groups automatically appears in this GlancePlus window after the prmconfig command is run. This tight integration between PRM and GlancePlus is useful for making changes in PRM and immediately seeing the results in GlancePlus. There are even more free resources now that we have lowered the share of PRM group db2 ; however, these remain idle even though we need them because our cap is in place and will not assign any system resources beyond those capped by our share. The job also takes much longer, as shown in the following output: $ time /tmp/job <-- results with 100 share real 44.5 user 7.7 sys 35.6 $ $ time /tmp/job <-- results with 10 share real 4:10.5 user 7.7 sys 35.3 The cap we implemented had the huge effect of going from a real time of 44.5 seconds to 250.5 seconds as a result of having capped the resources of users in our PRM group db2 . We can also use the graphical form of GlancePlus invoked with gpm to view the job as it runs, as shown in Figure 18-6: Figure 18-6. gpm Showing Reduced db2 Resources Figure 18-6 shows both the graphical and text windows of GlancePlus. Issuing ps -efP will show the PRM groups in the ps output as shown in the following abbreviated listing: [View full width]
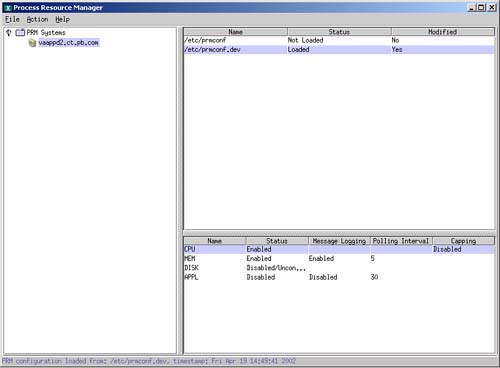
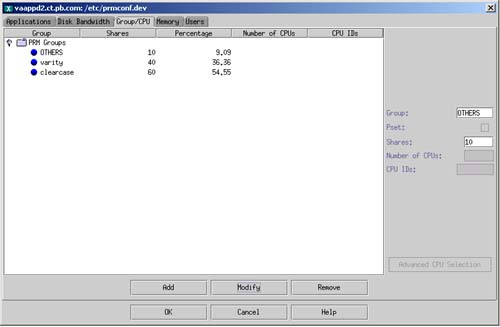
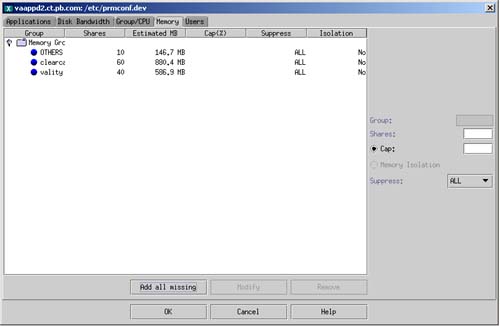
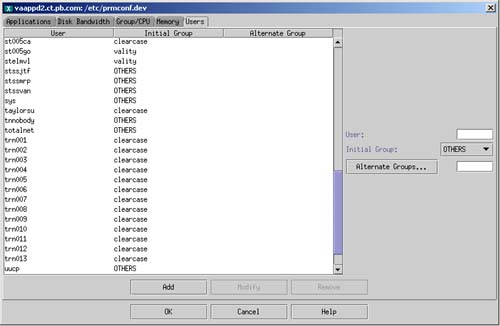
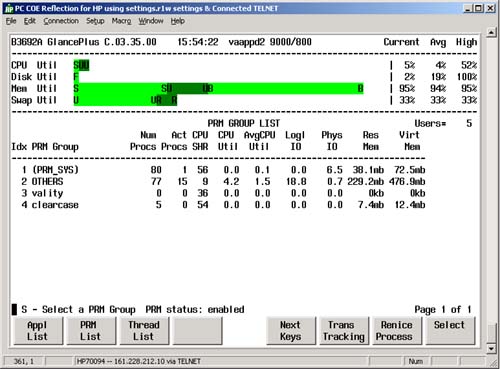
Two processes run by the PRMID db2 are shown immediately after the three dots. The find process has already consumed 23 in the C column and could use additional resources if we had not capped it. We can also view the output of system resources being used by PRM groups with the prmmonitor command, as shown in the following output: # prmmonitor PRM configured from file: /etc/prmconf.test File last modified: Mon Feb 11 12:43:01 2002 HP-UX dwdbp1 B.11.11 U 9000/800 02/19/02 Tue Feb 19 13:24:18 2002 Sample: 1 second CPU scheduler state: Enabled, CPU cap ON CPU CPU PRM Group PRMID Entitlement Used ____________________________________________________________ OTHERS 1 47.62% 13.15% DW 2 47.62% 0.00% db2 3 4.76% 4.46% PRM application manager state: Enabled (polling interval: 30 seconds) This output shows that db2 consumes very close to its CPU Entitlement when running the job. Note that the CPU scheduler state shows CPU cap ON . Capping is controlled at the command line with the following two commands to turn capping on and off, respectively: # prmconfig -M CPUCAPON # prmconfig -M CPUCAPOFF Capping can also be controlled with the GUI shown in the upcoming figures. We could have made all of the modifications to /etc/prmconf and the other PRM-related work using xprm . Figure 18-7 shows the /etc/prmconf file from our example and some of the modifications we could make using xprm : Figure 18-7. xprm and Configuration Data Figure 18-7 shows our original shares for the three PRM groups. In the right-hand side of the lower window we could modify the shares and cause them to take effect immediately by hitting the Modify button, as shown in Figure 18-8: Figure 18-8. xprm and Configuration Share Changed from 100 to 10 Through the xprm interface we can perform all PRM-related work; however, knowing the command-line method of working with PRM adds additional insight. Keep in mind that the management of the (PRM_SYS) group is handled for us automatically. The capping feature has many applications on enterprise systems, such as the case where users are funding a specific percentage of a system and will be allocated the same percentage of system resources that they are funding. If you were to turn off the capping feature then the limits specified for the PRM groups would be employed only at times of peak system load. This is covered in the next section. PRM Setup with xprmThis section describes the way in which you would configure PRM to control the amount of resources that processes use during peak system load. Using PRM, you can guarantee a minimum allocation of system resources at peak load. All of the prerequisites to PRM, such as installing and configuring the software covered earlier, must be done prior to performing the PRM-related work in this section. This procedure is nearly identical to the resource cap procedure covered in the previous section. In this procedure, however, we do not enable caps, thereby resulting in the restriction on system resources taking place only during system load. In the example in this section we'll use the PRM GUI ( xprm ) to perform configuration. The key component to guaranteeing system resources is the PRM group described earlier. The example in this section will define PRM groups and their respective shares using the Fair Share Scheduler (FSS) and not Processor Sets (PSETs). We have two development groups sharing this system. We'll create two PRM groups under the name of their respective development applications. We'll then specify shares for these two groups based on the amount of system resources we want them to consume at the time of peak system load. We'll first invoke the PRM GUI with the xprm command and copy the default PRM configuration file /etc/prmconf to /etc/prmconf.dev as shown in Figure 18-9: Figure 18-9. xprm With the Two Configuration Files The /etc/prmconf.dev file that we'll be working with was created by copying it in xprm . When we double-click prmconf.dev an additional window opens up that allows us to specify all information related to our configuration. Notice in this diagram that Capping is Disabled so that the entitlements we specify will be employed only at the time of peak system use and not as a general cap as described earlier. We'll first create our PRM groups and the amount of CPU we'd like each group to consume during peak system load, as shown in Figure 18-10: Figure 18-10. xprm With Groups and Amount of CPU Resources for Each The OTHERS group was created by default and we created the vality and clearcase groups. In addition, we created the shares shown for each of the groups with clearcase having the largest share. Next, we configure the memory shares for each group as shown in Figure 18-11: Figure 18-11. xprm With Groups and Amount of Memory Resources for Each The memory shares shown in Figure 18-11 are the same as those earlier created for CPU. Notice that in the right of this diagram is the option to employ a cap. We will not make this selection so that our limits on system resources will be employed only at times of peak system load. The Cap % column is blank indicating that we have not employed caps. Next we'll run the prmloadconf command to load all users from /etc/passwd into the /etc/prmconf.dev with which we're working. We can then specify the PRM groups with which the users will be associated, as shown in Figure 18-12: Figure 18-12. xprm with Users and Their Associated PRM Groups Most of the users on this system are in the clearcase PRM group, but when vality users start large sorts, all of the system resources are consumed by the sorts, and clearcase users get minimal system resources. The configuration is now complete, so we go back to the first xprm screen and enable /etc/prmconf.dev . We can use GlancePlus to view our PRM groups and see if our groups have been created, as shown in Figure 18-13: Figure 18-13. xprm With Users and Their Associated PRM Groups The PRM groups we configured as well as the CPU shares ( CPU SHR ) are shown in the figure. During times of peak system load, the PRM groups will be limited to the amount of resources we have specified. Although all of the work was done in xprm the /etc/prmconf.dev file was updated when we made and saved our changes. The following listing shows part of the /etc/prmconf.dev file with our configuration, with some of the users not shown because there are many users on the system: # # Group/CPU records # OTHERS:1:10:: clearcase:3:60:: vality:2:40:: # # Memory records # #!PRM_MEM:1:10:::: #!PRM_MEM:3:60:::: #!PRM_MEM:2:40:::: # # Application records # # # Disk bandwidth records # # # User records # adm::::OTHERS an001va::::clearcase best1::::OTHERS bin::::OTHERS bo001ya::::clearcase br001ca::::clearcase br002no::::clearcase careyji::::clearcase ccalbd::::OTHERS daemon::::OTHERS do004sh::::clearcase ga507ch::::clearcase gabapr::::clearcase hpdb::::OTHERS itvobadm::::clearcase janel::::clearcase janelle::::clearcase ju001ya::::clearcase ke004do::::clearcase kemekda::::clearcase kiesibw::::OTHERS leema::::clearcase lp::::OTHERS ma002we::::clearcase ma003ch::::clearcase maji::::clearcase nemapa::::clearcase nobody::::OTHERS nuucp::::OTHERS opc_op::::OTHERS pursnani::::clearcase root::::OTHERS sa002ab::::clearcase smbnull::::OTHERS st002st::::clearcase st005ca::::clearcase st005go::::vality stelmvl::::vality stssjtf::::OTHERS stssmrp::::OTHERS stssvan::::OTHERS sys::::OTHERS taylorsu::::clearcase tnnobody::::OTHERS totalnet::::OTHERS trn001::::clearcase trn002::::clearcase trn003::::clearcase trn004::::clearcase trn005::::clearcase trn006::::clearcase trn007::::clearcase trn008::::clearcase trn009::::clearcase trn010::::clearcase trn011::::clearcase trn012::::clearcase trn013::::clearcase uucp::::OTHERS vality::::vality webadmin::::OTHERS clearww::::OTHERS root@vaappd2[/etc] > We can also view our work by issuing the prmlist command to get a summary of our configuration: root@vaappd2[/etc] > prmlist PRM configured from file: /etc/prmconf.dev File last modified: Fri Apr 19 15:35:55 2002 PRM Group PRMID CPU Entitlement ------------------------------------------------------- OTHERS 1 9.09% clearcase 3 54.55% vality 2 36.36% Memory Upper PRM Group PRMID Entitlement Bound Suppress ------------------------------------------------------------------ OTHERS 1 9.09% ALL clearcase 3 54.55% ALL vality 2 36.36% ALL PRM User Initial Group Alternate Group(s) -------------------------------------------------------------------------------- adm OTHERS an001va clearcase best1 OTHERS bin OTHERS bo001ya clearcase br001ca clearcase br002no clearcase careyji clearcase ccalbd OTHERS daemon OTHERS do004sh clearcase ga507ch clearcase gabapr clearcase hpdb OTHERS itvobadm clearcase janel clearcase janelle clearcase ju001ya clearcase ke004do clearcase kemekda clearcase kiesibw OTHERS leema clearcase lp OTHERS ma002we clearcase ma003ch clearcase maji clearcase nemapa clearcase nobody OTHERS nuucp OTHERS opc_op OTHERS pursnani clearcase root OTHERS sa002ab clearcase smbnull OTHERS st002st clearcase st005ca clearcase st005go vality stelmvl vality stssjtf OTHERS stssmrp OTHERS stssvan OTHERS sys OTHERS taylorsu clearcase tnnobody OTHERS totalnet OTHERS trn001 clearcase trn002 clearcase trn003 clearcase trn004 clearcase trn005 clearcase trn006 clearcase trn007 clearcase trn008 clearcase trn009 clearcase trn010 clearcase trn011 clearcase trn012 clearcase trn013 clearcase uucp OTHERS vality vality webadmin OTHERS www OTHERS root@vaappd2[/etc] > All of the processes on this system should be in either the PRM group OTHERS or PRM_SYS since we did not specify another PRM groups to which processes would be assigned. The following truncated ps -efP listing shows the PRMID of processes: root@vaappd2[/etc] > ps -efP UID PRMID PID PPID C STIME TTY TIME COMMAND root (PRM_SYS) 0 0 0 Apr 9 ? 0:04 swapper root (PRM_SYS) 8 0 0 Apr 9 ? 0:00 supsched root (PRM_SYS) 9 0 0 Apr 9 ? 0:00 strmem root (PRM_SYS) 10 0 0 Apr 9 ? 0:00 strweld root (PRM_SYS) 11 0 0 Apr 9 ? 0:00 strfreebd root (PRM_SYS) 2 0 0 Apr 9 ? 0:22 vhand root (PRM_SYS) 3 0 0 Apr 9 ? 13:37 statdaemon root (PRM_SYS) 4 0 0 Apr 9 ? 0:11 unhashdaemon root (PRM_SYS) 12 0 0 Apr 9 ? 0:00 ttisr root OTHERS 383 1 0 Apr 9 ? 0:43 vpard root (PRM_SYS) 14 0 0 Apr 9 ? 0:00 ioconfigd root (PRM_SYS) 1 0 0 Apr 9 ? 0:05 init root (PRM_SYS) 20 0 0 Apr 9 ? 0:51 lvmkd root (PRM_SYS) 21 0 0 Apr 9 ? 0:51 lvmkd root (PRM_SYS) 22 0 0 Apr 9 ? 0:52 lvmkd root (PRM_SYS) 23 0 0 Apr 9 ? 0:52 lvmkd root (PRM_SYS) 24 0 0 Apr 9 ? 0:52 lvmkd root (PRM_SYS) 25 0 0 Apr 9 ? 0:51 lvmkd root (PRM_SYS) 26 0 0 Apr 9 ? 0:02 smpsched root (PRM_SYS) 27 0 0 Apr 9 ? 0:02 smpsched root (PRM_SYS) 28 0 0 Apr 9 ? 0:02 smpsched root (PRM_SYS) 29 0 0 Apr 9 ? 0:00 sblksched root (PRM_SYS) 30 0 0 Apr 9 ? 0:00 sblksched root OTHERS 1793 1 0 Apr 9 console 0:00 /usr/sbin/getty console root OTHERS 1593 1248 0 Apr 9 ? 0:13 diaglogd root (PRM_SYS) 36 0 0 Apr 9 ? 11:32 vxfsd root OTHERS 377 1 0 Apr 9 ? 0:31 /usr/sbin/syncer root (PRM_SYS) 570 0 0 Apr 9 ? 0:00 nfskd root OTHERS 380 1 0 Apr 9 ? 0:00 vphbd -d 360 -p vph bd.pid . . . root OTHERS 3693 3368 0 13:32:36 pts/tc 0:00 script root OTHERS 4156 1521 0 14:14:08 ? 0:00 /usr/local/sbin/sshd root OTHERS 4562 1 0 14:40:39 ? 0:05 /opt/prm/bin/prm2d root OTHERS 3368 3367 0 12:51:57 pts/tc 0:00 -sh root OTHERS 19232 1 0 Apr 10 ? 6:40 /usr/bin/dsmc sched root OTHERS 5233 4651 3 15:44:32 pts/td 0:00 ps -efP root OTHERS 19235 1 0 Apr 10 ? 0:00 /usr/bin/dsmcad root@vaappd2[/etc] > The prmmonitor can also be used at the command line to show the entitlements and amount of resources used as shown in the following listing: root@vaappd2[/etc] > prmmonitor PRM configured from file: /etc/prmconf.dev File last modified: Fri Apr 19 15:35:55 2002 HP-UX vaappd2 B.11.11 U 9000/800 04/19/02 Fri Apr 19 15:50:14 2002 Sample: 1 second CPU scheduler state: Enabled CPU CPU PRM Group PRMID Entitlement Used ____________________________________________________________ OTHERS 1 9.09% 5.45% vality 2 36.36% 0.00% clearcase 3 54.55% 0.00% Fri Apr 19 15:50:14 2002 Sample: 1 second Memory manager state: Enabled Paging: No Memory Upper PRM Group PRMID Entitlement Bound Usage Procs Stops _______________________________________________________________________________ OTHERS 1 9.09% 10.39% 62 vality 2 36.36% 0.00% 0 clearcase 3 54.55% 0.35% 5 PRM application manager state: Disabled (polling interval: 30 seconds) root@vaappd2[/etc] > Please keep in mind that the entitlements shown are enforced only at the time of peak system load so that PRM groups can exceed their entitlement, such as the OTHERS memory usage shown in the previous listing, if indeed the system is not at peak load and resources are available. The procedure covered in this section is very similar to the "resource cap" procedure in the previous section, except that the xprm GUI was used for the configuration and that caps were not employed as part of this procedure. The process covered in this section is common on systems where peak load is often encountered and system administrators want to guarantee system resources for all users. |
EAN: 2147483647
Pages: 301