| The command line is a way of life when working with UNIX. UNIX grew out of the command line and is still primarily command line-based . Although you need to know a lot when issuing commands, especially when it comes to system performance, you can dig deeply very quickly with many of the commands I just covered. You have the option with most UNIX variants to buy graphical performance tools. Some systems come with basic graphical performance tools, but will usually end up buying an advaced performance analysis tool if you want to perform advanced performance analysis. We'll take a quick look at a few performance tools in upcoming sections. Figure 11-1 shows three performance tools that came with the Red Hat Linux system I used for many of the examples in this chapter: Figure 11-1. Red Hat Linux Performance Tools Screen Shot 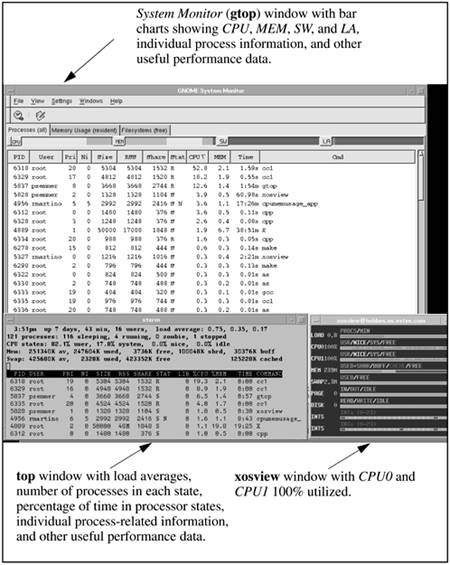  | The three performance tools shown in this diagram are xosview in the lower right, the System Monitor across the top of the screen, and top shown in the lower left. The System Monitor provides bar charts across the top of the screen that indicate the amount of CPU, Memory, Swap, and LAN utilization taking place. There is then tabular data supplied for every process on the system. The System Monitor is a graphical version of top that I invoked with the command gtop for g raphical top . xosview is a small load meter that you can keep running that provides bar charts of system activity shown in the bottom right window. This is the X Windows o perating s ystem view program, hence the name xosview . You can't see the bar charts clearly in this diagram, because this is a color -based application and the book is printed in only black and white. The bar charts are, however, clear on the computer screen. The final, and most often used, tool on UNIX systems is the character version of top that is running in the bottom left xterm . top is found on many UNIX variants and supplies a lot of useful system information. | Among the useful top system data displayed is the following: -
- Load averages in the last one, five, and fifteen minutes. -
- Number of existing processes and the number of processes in each state. -
- Percentage of time spent in each of the processor states per processor on the system. This same information is included in the bottom of the System Monitor window, which is covered by the top and xosview windows.  | Next in the top window is memory data, including used, free, and shared. | Data is also provided for individual processes in a format similar to ps , including the following: PID - Process ID number. USER - Name of the owner of the process. PRI - Current priority of the process. NI - Nice value, ranging from -20 to +20. SIZE - Total size of the process in kilobytes. RSS - Resident size of the process in kilobytes. STATE - Current state of the process. TIME - Number of system and CPU seconds the process has consumed. %CPU - CPU percentage. %MEM - Memory percentage. COMMAND - Name of the command the process is currently running. | | As with most of the commands we have been covering, top is different among UNIX variants. You may see some different fields on the various UNIX variants. I am usually confident when I sit down at any UNIX system that I can run top and quickly see how the system is running. Most versions of top I have run are character-based applications, so you don't even need a graphics terminal to run them. I have run top in this example in character mode within an X terminal. | The system used in this example has two CPUs. If you look carefully in the xosview window, you'll see that both CPU0 and CPU1 are 100 percent used. At the time this screen shot was obtained, I was compiling the Linux kernel on this system, which consumed all the CPU resources on the system for a short period of time. You can see from both the top and System Monitor windows that the program cc1 , used to compile the kernel, was consuming a substantial amount of the CPU resources on the system. Figure 11-1 helps illustrate how different tools can help with viewing how system resources are consumed. xosview provides a quick reference, graphical overview of how many system resources are being consumed. top and System Monitor can then be used to determine the specific process consuming the most system resources. |