Implementing Quality Control
|
| < Day Day Up > |
|
Quality control (QC) requires the project manager, or other qualified party, to monitor and measure project results to determine that the results are up to the demands of the quality standards. If the results are not satisfactory, root cause analysis follows the quality control processes. Root cause analysis is needed so the project manager can determine the cause and apply corrective actions. On the whole, QC occurs throughout the life of a project, not just at its end.
QC is also not only concerned with the product the project is creating, but with the project management processes. QC measures performance, scheduling, and cost variances. The experience of the project should be of quality-not just the product the project creates. Consider a project manager that demands the project team work extreme hours to meet an unrealistic deadline; team morale suffers and likely so does the project work the team is completing.
The project team should have the following skill sets to be competent at quality control:
-
Statistical quality control, such as sampling and probability
-
Inspection to keep errors away from the customer
-
Attribute sampling to measure conformance to quality on a per unit basis
-
Variable sampling to measure conformance to quality as a whole
-
Special causes to determine anomalies to quality
-
Random causes to determine expected variances of quality
-
Tolerance range to determine if the results are within, or without, an acceptable level of quality
-
Control limits to determine if the results are in, or out, of quality control
Preparing for Quality Control
Quality control relies on several inputs:
-
Work results The results of both the project processes and the product results are needed to measure and compare to the quality standards. The expected results of the product and the project can be measured from the project plan.
-
Quality management plan This plan defines how the project team will meet the quality policy.
-
Operational definitions The operational definitions that define the metrics for the project are needed so QC can measure and react to the results of project performance.
-
Checklists If the project is using checklists to ensure project work is completed, a copy of the checklists will be needed as part of quality control. The checklists can serve as an indicator of completed work-and expected results.
Inspecting Results
Although quality is planned into a project, not inspected in, inspections are needed to prove the conformance to the requirements. An inspection can be done on the project as a whole, a portion of the project work, the project deliverable, or even an individual activity. Inspections are also known as:
-
Review
-
Product reviews
-
Audits
-
Walkthroughs
Creating a Control Chart
Ever feel your project is out of control? A control chart can prove it.
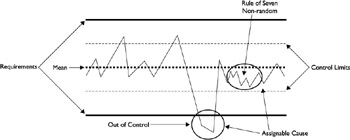
Control charts illustrate the performance of a project over time. They map the results of inspections against a chart as seen in Figure 8-3. Control charts are typically used in projects, or operations, where there are repetitive activities-such as manufacturing, a series of testing, or help desks.

Figure 8-3: Control charts illustrate the results of inspections.
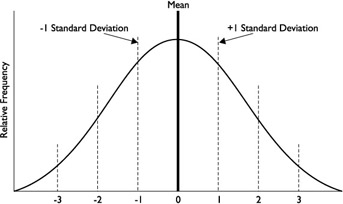
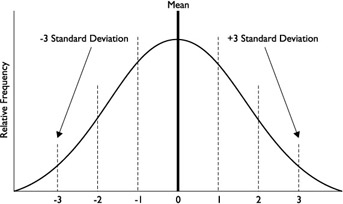
The outer limits of a control chart are set by the customer requirements. Within the customer requirements are the Upper Control Limits (UCL) and the Lower Control Limits (LCL). The UCL is typically set at +3 or +6 sigma, while the LCL is set at -3 or -6 sigma. Sigma results show the degree of correctness. Table 8-1 shows the four sigma values representing normal distribution. You'll need to know these for the PMP exam.
| Value | Percent Correct |
|---|---|
| +/- 1 sigma | 68.26 percent |
| +/- 2 sigma | 95.46 percent |
| +/- 3 sigma | 99.73 percent |
| +/- 6 sigma | 99.99 percent |
So what happened to sigma four and five? Nothing. They're still there; it's just the difference between three sigma at 99.73 and six sigma at 99.99 are so small that statisticians just jump onto six sigma. The mean in a control chart represents the expected result, while the sigma values represent the expected spread of results based on the inspection. A true six sigma allows only two defects per million opportunities and the percentage to represent that value is 99.99985%. For the exam, you can go with the 99.99%.

For example, if a manufacturer creates 1000 units per hour, and expects 50 units each hour to be defective, the mean would be 950 units. If the control limits were set at +/- three sigma, the results of testing would actually expect up to 953 correct units and down to 947 correct units.

Over time, the results of testing are plotted in the control chart. Whenever a result of testing is plotted beyond the upper or lower control values, it is considered to be 'out of control.' When a value is out of control, there is a reason why-it's called an assignable cause. Something caused the results to change for better or for worse, and the result must be investigated to understand the why behind the occurrence.
Another assignable cause is 'the Rule of Seven.' The Rule of Seven states that whenever seven consecutive results are all on one side of the mean, this is an assignable cause. There has been some change that caused the results to shift to one side of the expected mean. Again, the cause must be investigated to determine why the change has happened.
While control charts are easily associated with recurring activities, like manufacturing, they can also be applied to project management. Consider the number of expected change requests, delays within a project, and other recurring activities. A control chart can plot out these activities to measure performance, positive and negative results, and track corrective actions.
| On the Job | Some project managers may believe that there should be no variance at all in the results of testing-they expect it to be 100 percent correct all the time. In some instances, this is valid; consider hospitals, military scenarios, and other situations dealing with life and death. When a project manager demands 100-percent perfection, the cost of quality issues needs to be revisited. What is the cost of obtaining perfection, versus the cost of obtaining 98 percent correctness? |
Creating Pareto Diagrams
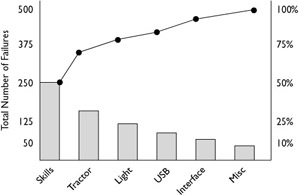
A Pareto diagram is somewhat related to Pareto's Law: 80 percent of the problems come from 20 percent of the issues. This is also known as the 80/20 rule. A Pareto diagram illustrates the problems by assigned cause from smallest to largest, as Figure 8-4 shows. The project team should first work on the largest problems and then move onto the smaller problems.

Figure 8-4: A Pareto diagram is a histogram that ranks the issues from largest to smallest.
Completing a Statistical Sampling
Statistical sampling is a process of choosing a percentage of results at random. For example, a project creating a medical device may have 20 percent of all units randomly selected to check quality. This process must be completed on a consistent basis throughout the project, rather than on a sporadic schedule.
Statistical sampling can reduce the costs of quality control, but mixed results can follow if an adequate testing plan and schedule are not followed. The science of statistical sampling, and its requirements to be effective, is an involved process. There are many books, seminars, and professionals devoted to the process. For the PMP exam, know that statistical sampling uses a percentage of the results to test for quality. This process can reduce quality control cost.
Revisiting Flowcharting
Flowcharting uses charts to illustrate how the different parts of a system operate. Flow-charting is valuable in quality control because the process can be evaluated and tested to determine where in the process quality begins to break down. Corrective actions can then be applied to the system to ensure quality continues as planned-and as expected.
Applying Trend Analysis
Trend analysis is the science of taking past results to predict future performance. Sports announcers use trend analysis all the time: 'The Cubs have never won in Saint Louis, on a Tuesday night, in the month of July, when the temperature at the top of the third inning is above 80 degrees.'
The results of trend analysis allow the project manager to apply corrective action to intervene and prevent unacceptable outcomes. Trend analysis on a project requires adequate records to predict results and set current expectations. Trend analysis can monitor:
-
Technical performance Trend analysis can ask, 'How many errors have been experienced by this point in the project schedule, and how many additional errors were encountered?'
-
Cost and schedule performance Trend analysis can ask, 'How many activities were completed incorrectly, or came in late, or had significant cost variances?'
|
| < Day Day Up > |
|
EAN: 2147483647
Pages: 209