Performance Analysis Tools and Processes
|
| < Day Day Up > |
|
Linux treats each task performed on your system as a process, which is assigned a number and a name. You can examine these processes and even stop them. Red Hat provides several tools for examining processes as well as your system performance. Easy monitoring is provided by several GUI tools, like Red Hat's Procman System Monitor.
ps Command
From the command line, you can use the ps command to list processes. With the -aux option, you can list all processes. Piping the output to a grep command with a pattern enables you to search for a particular process. A pipe funnels the output of a preceding command as input to a following command. The following command lists all X Window System processes:
ps -aux | grep 'X'
A number of utilities on your system provide detailed information on your processes, as well as other system information such as CPU and disk use (see Table 27-10). Although these tools were designed to be used on a shell command line, displaying output in text lines, several now have KDE and GNOME versions that provide a GUI interface for displaying results and managing processes.
| Performance Tool | Description |
|---|---|
| vmstat | Performance of system components |
| top | Listing of most CPU intensive processes |
| free | Listing of free RAM memory |
| sar | System activity information |
| iostat | Disk usage |
| Procman System Monitor | Red Hat system monitor for processes and usage monitoring (System Monitor on System Tools menu). |
| KDE Task Manager and Performance Monitor | KDE system monitor for processes and usage monitoring |
vmstat, free, top, iostat, Xload, and sar
The vmstat command outputs a detailed listing indicating the performance of different system components, including CPU, memory, I/O, and swap operations. A report is issued as a line with fields for the different components. If you provide a time period as an argument, it repeats at the specified interval—usually a few seconds. The top command provides a listing of the processes on your system that are the most CPU intensive, showing what processes are using most of your resources. The listing is in real time and updated every few seconds. Commands are provided for changing a process's status, such as its priority.
The free command lists the amount of free RAM memory on your system, showing how much is used and how much is free, as well as what is used for buffers and swap memory. Xload is an X Window System tool showing the load, CPU, and memory. iostat displays your disk usage, and sar shows system activity information.
Procman System Manager
The current version of Red Hat provides the Procman System Manager for displaying system information and managing system processes, accessible from System Tools | System Monitor. There are two panels, one for processes and one for system information. The System Monitor panel displays graphs for CPU, Memory, and Swap memory usage (see Figure 27-3). Your disk devices are also listed, showing the amount of disk space used and how much is free. The Process Listing panel lists your processes, letting you sort or search for processes. You can use field buttons to sort by name, process ID, user, memory, and even percentage of CPU time used. The View pop-up menu lets you select all processes, just your own, or active processes. You can easily stop any process by selecting it and then clicking the End Process button. Right-clicking an item displays actions you can take on the process such as stopping or hiding it. The Memory Maps display, selected from the View menu, shows information on virtual memory, inodes, and flags.
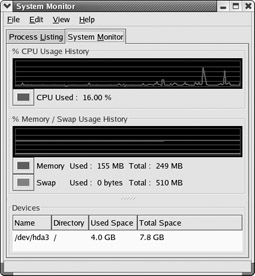
Figure 27-3: Procman System Manager
GNOME System Manager (GTop)
With the GNOME System Manager (GTop), you can sort the processes according to their fields by clicking the field's button at the top of the process list. If you right-click an entry, a pop-up menu displays actions you can perform on that entry. System statistic summary graphs are displayed at the top of the window, showing the CPU load, memory use, and disk use. You can add more graphs or change their display features, such as the colors used. The GTop window displays three tabbed panels for detailed reports showing processes, memory use, and file system use. You can add more, showing customized reports such as only the user processes. Process lists can be further refined to show user, system, or all processes. To configure GTop, select the Settings | Preferences to display a menu with tabbed panels for specifying the update frequency for different statistics, determining the summaries you want displayed, and what process fields to show. You can find the GNOME System Manager in the Utilities menu.
KDE Process Manager (kpm)
The K Desktop provides the KDE Process Manager (kpm) for viewing and managing your processes. You can sort the processes according to their fields by clicking the field's button at the top of the process list. If you select a process, you can then choose to perform several different actions on it, such as ending it (killing the process) or suspending it (putting it to sleep). Right-clicking a process entry displays a pop-up menu with the different actions you can take. You can further refine your process list by choosing to view only your own processes, system processes, or all processes.
KDE Task Manager and Performance Monitor (KSysguard)
Red Hat also provides the KDE Task Manager and Performance Monitor, KSysguard, accessible from the Extras System Tools menu as KDE System Guard. This tool allows you to monitor the performance of your own system as well as remote systems. KSysguard can provide simple values or detailed tables for various parameters. A System Load panel provides graphical information about CPU and memory usage, and a Process Table lists current processes using a tree format to show dependencies. You can design your own monitoring panels with worksheets, showing different types of values you want to display and the form you want to display them in, like a bar graph or digital meter. The Sensor Browser pane is an expandable tree of sensors for information like CPU System Load or Memory's Used Memory. There is a top entry for each host you are connected to, including your own localhost. To design your own monitor, create a worksheet and drag and drop a sensor onto it.
|
| < Day Day Up > |
|
EAN: 2147483647
Pages: 328