Introducing Access Reports
Introducing Access ReportsYou often want printed listings of your data, and the Access reporting tools enable you to produce professional reports with ease. This hour introduces you to the report wizards and discusses the different reporting styles and options available. You learned how to produce printed listings in Hour 18, "Entering and Displaying Access 2003 Data." In this hour, you learn how to add flair to your reports. Keep in mind that discussions of Access's reporting wizards could fill an entire book. Although you will not be a complete master at the end of this hour , you'll have a better idea of what reporting tools you can use. Unlike forms, a report often displays multiple records in a view that resembles the Datasheet view. The difference between the Datasheet view and a printed report is that the report provides summary statistics, fancy headings, footers, page numbers , and styles that accent your data. In addition, you can pick and choose exactly what data the report is to include as well as group that data to subtotal and total certain pieces of data in the database.
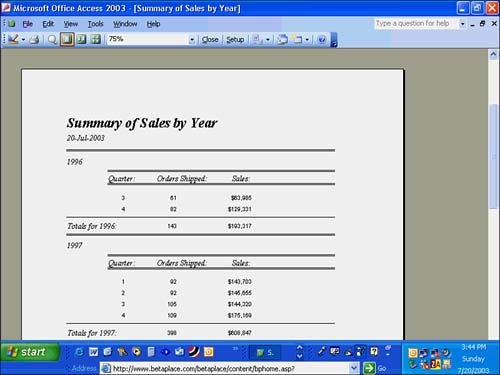
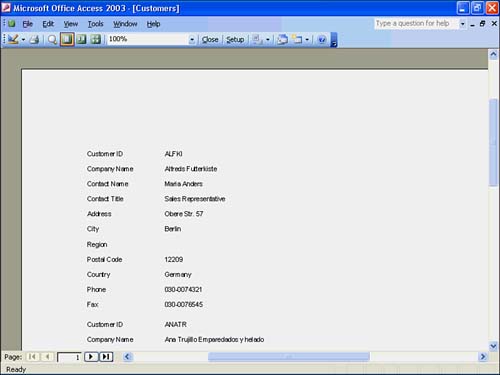
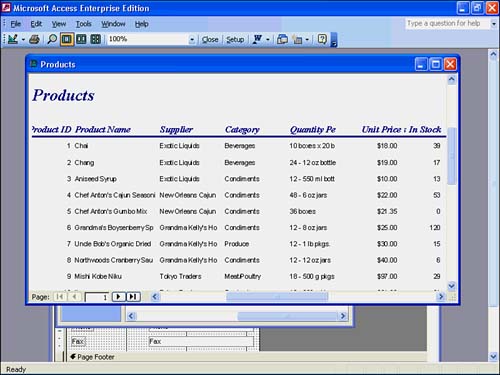
Before you print any report, use the Print Preview to see the report on your screen. Often, you notice changes that you need to make, so previewing a report can save you time and paper. Your computer's print spooler (the area of memory that holds your report while printing) is too fast to stop quickly, so you usually end up printing the first few pages of a report even if you attempt to stop the printing. When you are about to print a report, click the Reports object in the left pane of the Database window, select a report, and click the Preview button on the Database window's toolbar. Access can generate nice reports (see Figure 20.1). Figure 20.1. The report preview shows how Access formats your report. Rarely do you report all the data from a single table. Except for detailed reports, such as inventory listings and master customer listings, you almost always report part of a table or values from multiple tables. Almost all reports that you generate, therefore, get their data from queries that you have created. If you need to report from part of a table's data or from multiple tables, create a query on which to base the report. Your queries can order the data the way you want to see it, and Access can then print your query's results. Generating Simple Reports Using AutoReportsAccess includes an AutoReport feature, which quickly generates reports from your Datasheet views. As Figure 20.2 shows, the AutoReport feature is just a listing of field names and their corresponding field values. Figure 20.2. AutoReport generates simple reports. Unlike the printed listings you get when you select File, Print from the Datasheet view, AutoReport formats your data in a readable manner without squeezing too much information on a single page. To Do: Produce Quick ReportsIf you need to run a quick report from a table, follow these steps to enable AutoReport to generate the report:
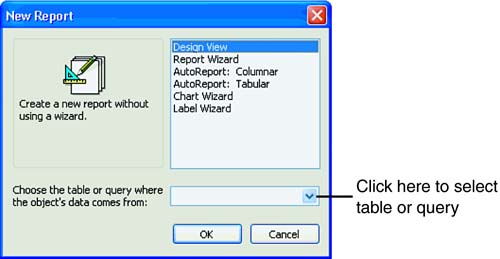
If you like using AutoReport for quick reports, check out the AutoForm feature. AutoForm creates fast and simple forms from your Datasheet views. Generating Reports Using the Report WizardsAccess includes several report wizards that design reports according to the specifications you give. Select one of the report wizards by opening the Database window, clicking the Reports object (which displays the reports currently defined in the database), and clicking the New button to create a new report. The New Report screen (see Figure 20.4) appears. Figure 20.4. Request a report from the New Report dialog box. The New Report dialog box enables you to access the following reporting components :
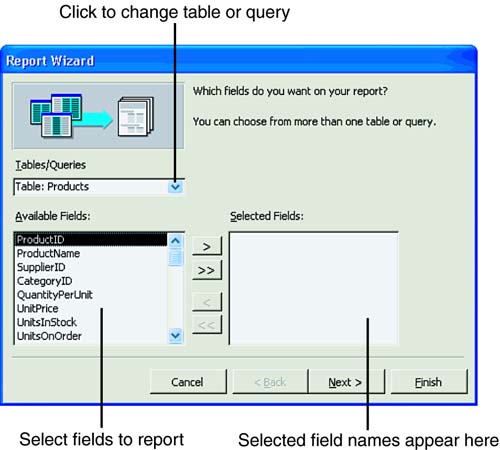
To Do: Use the Report WizardThe second New Report screen option, Report Wizard, is probably the most common selection you make when you generate customized reports. The Report Wizard walks you through a series of steps to create a custom report from your tables and queries, and it includes many common reporting styles and special features that you need.
To start the Report Wizard, follow these steps:
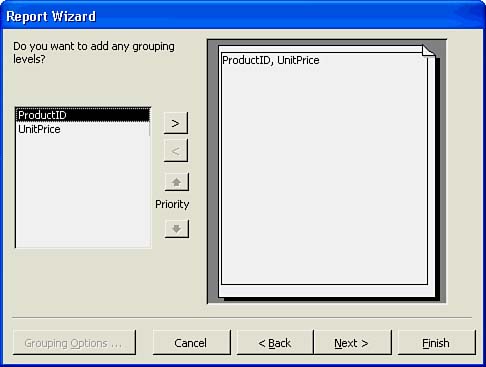
Grouping Report SummariesNow that you have selected the report fields, you must indicate how the report is to be summarized. Rarely will you want to print a data listing without requesting a report summary that includes totals and subtotals. Depending on the type of numeric fields you have selected for the report, the Report Wizard prompts you for subtotal and total summary information or grouping information. If your report contains numeric data, the Report Wizard lets you choose the grouping options (shown in Figure 20.7). Use this dialog box to indicate how you want Access to group your report subtotals. Figure 20.7. Indicate how Access is to produce the subtotals and totals.
If Access does not display the Summary dialog box, the Report Wizard prompts you for grouping information, and you can select the field on which you want your data grouped. When you request grouping, you are telling Access how to sort your report. If you grouped by a City field, for example, the report would sort the report in City order. The subtotals are then summed for each city in the report data. You might have to run the Report Wizard a couple of times to group the report the way you prefer. Be sure to select only those numeric fields that produce proper subtotals. If you report a division number field and that field is numeric, for example, you wouldn't want Access to subtotal and total the division number. If you print a report with customer past-due balances, however, you do want to print a subtotal for each customer and an overall grand total of past-due balances . The grouping field should be nonnumeric groups, such as customer IDs, for which you are printing a detailed list. Although the same customer might appear on several report lines, you want Access to subtotal only when the customer ID changes to the next customer in the report. The grouping doesn't total or subtotal the customer IDs, but the totals and subtotals that appear all break (stop) when the customer ID changes. The grouping capability keeps multiple customer IDs from appearing down the column when you print multiple records for the same customer. As you click each field that you selected, the grouping dialog box displays a preview of your report, showing how the grouping will fall out. Generally, the grouping options and preview give you enough information to decide on a grouping scheme. If you want to group on multiple fields, the group order you select determines the priority that Access uses to group the data. The highest priority grouping level (if you select multiple groups) appears on the left of the report. You can change the highest priority level by clicking the Priority button on another grouping level. The second grouping level appears to the right of the first one, and so on. Generally, multifield grouping gets confusing. If you want to add such grouping levels, click every group level from the series of fields that Access displays. The Report Wizard prioritizes the multifield groups in the order that you select the fields.
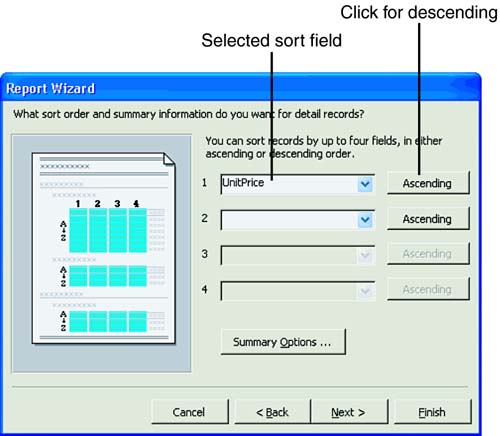
If the Report Wizard has presented you with the grouping view screen rather than the subtotal and total summary screens described here, you need only click the field by which you want to group the report. If you are producing a customer balance report, for example, the Report Wizard might enable you to group by either the Customer ID field or the Customer Order Number field. After you set up the grouping levels that you need, click Next to select a sort and summary order for the report. The Report's Sort and Summary OrderWhen you see the sorting and summary screen (see Figure 20.8), you are almost done creating your report. Select from one to four fields that you want Access to use for sorting your data. If you are reporting from a query that already contains sorted data, and if you generate the report so that the data groups in the order of those sorted fields, don't select any fields by which to sort. If you want to sort by one or more fields that do not enter the reporting system already sorted, however, select up to four fields and click the button labeled Ascending to sort in ascending order. Figure 20.8. Select from one to four fields by which to sort.
If you requested totals and subtotals in earlier Report Wizard steps, you will see a Summary Options button. These options display the Report Wizard's Summary Options screen. Each of your report's numeric fields appears in the box, so you can select any or all these summaries for that field:
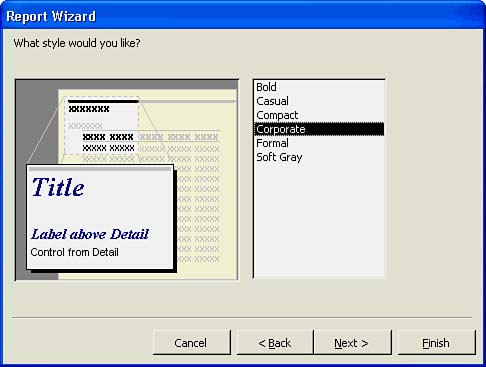
Choosing a Report Layout and StyleClick OK to close the Summary Options screen and then click Next to choose a report layout. Click through the various layouts to select one that fits your needs. As you click layouts, Access displays thumbnail sketches of those layouts. If you click the Block style, for example, you see that Access displays boxes around your report fields. After you select the layout, click Next to select from the Report Wizard's style screen (shown in Figure 20.9). From this dialog box, you can add the finishing touches to your report. Figure 20.9. The Report Wizard's style screen determines the overall appearance of your report. Click Next, enter a report title if you don't want to use the original source table or query name, and click Finish to generate the completed report. Sometimes Access takes several minutes to generate the report, especially if the source tables and queries contain many records and your report contains several grouping levels. When finished, Access prints a preview of your report so that you can look at your handiwork. |
EAN: 2147483647
Pages: 272