Receiver Operating Characteristic Curves
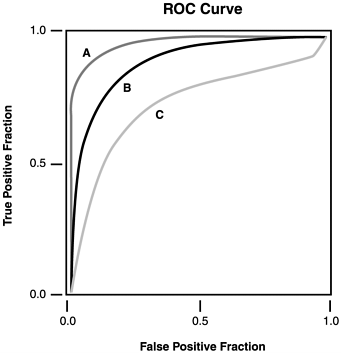
| The receiver operating characteristic (ROC) curve is a method of graphically demonstrating the relationship between sensitivity and specificity. An ROC curve plots the true positive rate (sensitivity) against the false positive rate (1 minus specificity). This graph serves as a nomogram (a graphical representation of numerical relationships). After choosing a desired cutoff point, the IDS's sensitivity and specificity can be determined from the graph. The curve's shape correlates with the accuracy or overall quality of the IDS. A straight line moving up and to the right at 45 degrees implies a useless IDS. In contrast, an IDS in which the ROC curve is tucked into the upper left-hand corner of the plot offers the best information. Quantitatively, the area under the curve is correlated directly with the accuracy of the IDS. As an example, in Figure 14.3, IDS B is more accurate than IDS C. Similarly, IDS A has the highest accuracy of all. Figure 14.3. ROC curves. Positive and Negative Predictive ValuesTheoretically, sensitivity and specificity are properties of the IDS itself; therefore, these properties are independent of the network being monitored . Thus, sensitivity and specificity tell us how well the IDS itself performs, but they do not show how well it performs in the context of a particular network. In contrast, predictive value accounts for variations in underlying networks, and is more useful in practice. Predictive values are real-world predictions derived from all available data. Predictive value combines prior probability with IDS results to yield post-test probability expressed as positive and negative predictive values. This combination constitutes a practical application of Bayes theorem , which is a formula used in classic probability theory. Information based on attack prevalence in your network is adjusted by the IDS result to generate a prediction. Most network administrators already perform this analysis intuitively, but imprecisely. For example, if you know that slow ping sweeps have recently become prevalent against your network, then you unconsciously use that information to evaluate data from your IDS. When various predictors are linked mathematically, they must be transformed from probabilities to odds. Then they are referred to as likelihood ratios (LRs) or odds ratios (ORs) and can be combined through simple multiplication. Likelihood RatiosSensitivity, specificity, and predictive values are all stated in terms of probability, which is the estimated proportion of time that intrusions occur. Another useful term is odds (the ratio of two probabilities, ranging from 0 [never] to infinity [always]). For example, odds of 1 are equivalent to a 50% probability of an intrusion (just as likely to have occurred as not to have occurred). The mathematical relation between these concepts can be expressed as follows : Odds = probability / (1 - probability) Probability = odds / (1 + odds) LRs and ORs are examples of odds. LRs yield a more sophisticated prediction because they employ all available data. The LR for a positive IDS result is defined as the probability of a positive result in the presence of a true attack divided by the probability of a positive result in a network not under attack (true positive rate / false positive rate). The LR for a negative IDS result is defined as the probability of a negative result in the absence of a true attack divided by the probability of a negative result in a network that is under attack (true negative rate / false negative rate). LRs enable more information to be extracted from a test than is allowed by simple sensitivity and specificity. When working with LRs and other odds, post-test probability is obtained by multiplying together all the LRs. The final ratio can also be converted from odds to probability to yield a post-test probability. In summary, by applying these statistical methods , you can make more intelligent choices about deploying IDSs throughout a network. Although currently fraught with inaccuracy, the field of intrusion detection is still emerging; thus, it is too early to dismiss it as entirely useless. As time goes on, use of the scientific method will help improve this inexact and complex technology. By understanding the sensitivity and specificity of an IDS, we can learn its value and when to use it. In addition, the increasing use of likelihood ratios will make the data that you receive from your IDSs more meaningful. |
EAN: 2147483647
Pages: 171
