Chapter 10: Windows Services Debugging
Creating a windows service with VB.Classic is always a messy and error-prone activity. You can use the srvany utility or the ntsvc.ocx control, but both of these methods have problems and debugging the resulting issues is difficult and frustrating (see Microsoft Knowledge Base article Q175948 for some warnings about the problems). This restriction on VB.Classic's capability to create reliable Windows services is a shame because these programs can be invaluable for creating long-running processes that can function without an interactive user . I've used Windows services to act as permanently available middle- tier application components, as load-balancing database gateways, as application sentinels to monitor various components , and as programs that allow remote control (over an intranet) of other services on a machine.
With VB .NET, you finally have the tools to create reliable Windows services. With this freedom come some responsibilities, as these services typically require multithreading skills and knowledge of a slightly unusual flow of control. This chapter examines how to debug Windows services, including both in-place and IDE debugging, debugging of the OnStart method, and debugging installation issues.
Debugging the ServiceAdmin Service
The ServiceAdmin Windows service is a real-life program written to solve a specific problem. It's very common in distributed applications to place middle-tier components on one or more application server machines, and frequently those middle-tier components are Windows services. When your application misbehaves, possibly because of a middle-tier component problem, it can be very tiresome to have to trudge around each of the application servers looking for the errant service. Even if you have a server administrator to do the serious legwork for you, you still have to give him or her precise instructions about which services to investigate and what to do in the event of finding a problem. Often you need to have a form signed in triplicate by three pointy-haired bosses just to restart a production service.
ServiceAdmin is a Windows service that you can run on each of your application servers. It presents a Web page that allows you to see the status of designated Windows services on that server. You can monitor each server just by typing its IP address and a port number into a Web browser. You could even enhance ServiceAdmin to allow you to pause, stop, start, or restart the services that you're monitoring. The idea is to save you from having to walk around investigating each of your servers in person, and to give you control over your middle-tier Windows services without having to trouble your server administrators. In essence, ServiceAdmin is a remote service administrator program acting as a miniature Web server.
Debugging Preparation
Running and debugging a Windows service by pressing F5 within the IDE is problematic because a service normally has to be installed before it can run. Later in this chapter, in the section entitled "Debugging a Service Without Installing It,"
I describe a technique for doing exactly that by writing code that simulates a service start when using the Debug configuration. For the moment, I'll talk about debugging a service after it's been released and installed.
First, load and build the ServiceAdmin solution, taking care to ensure that you build using the Release configuration (not the Debug configuration). Once you've loaded and built the ServiceAdmin solution, you need to install it as a service on your machine. You can do this using the installutil.exe utility. Go to the .NET command line and navigate to the folder containing the ServiceAdmin executable. Then type the command line installutil /Logfile=install.txt ServiceAdmin.exe . The installer utility will install this service under the LocalSystem account, which doesn't require you to provide an account password. If, alternatively, you want to install your service under a user account, you should be careful to specify the full machine name before the account name when prompted by the installer. This is because the installer seems to be rather finicky about the exact format of the account name that it accepts. On my machine, Cheetah\MarkPearce works fine because my machine is called Cheetah.
Once the installation routine has run, you can check that the service installed properly by using the Services applet in the Control Panel to check its status. If the service didn't install for some reason, you should check the installation log file (in this case, install.txt) to see why the installation failed. The most common reasons for failure are using an incorrect machine name, account name, or account password, but this can be difficult to diagnose because some of the failure messages are rather cryptic. In addition, if you're running a local fire-wall, you may be prompted by the firewall to give ServiceAdmin permission to listen on port 5005.
Once you've successfully installed ServiceAdmin , you can start the service from the aforementioned Services applet. At this point, the service spawns a main thread that listens on the designated port for client requests . Each client request starts a new thread that responds to the request and then sends a fresh Web page to the client showing the status of the services after the request has been performed.
Figure 10-1 shows the Web page produced by ServiceAdmin when I type the URL http://localhost:5005/status.html into my Web browser. Note that the //localhost address means that I'm talking to ServiceAdmin running on my local machine. If you wanted to communicate with ServiceAdmin running on a remote machine, you would replace localhost with the remote machine's IP address, which you can find by running ipconfig.exe from the command line of the remote machine. The number 5005 is the port on which ServiceAdmin is listening for client requests. Currently this port number is hard-coded, but in the real world it should really be specified using ServiceAdmin 's configuration file.
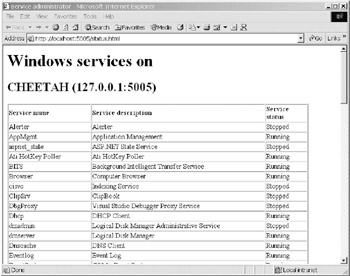
Figure 10-1: The ServiceAdmin Web interface for remote control of services
Debugging with Process Attach
Once the service is up and running, you can attach the Visual Studio debugger to the service process. To do this, load the ServiceAdmin solution into Visual Studio and add a breakpoint to line 42 of the ServiceListener.vb class in the ServiceAdmin project. Line 42 is the line that accepts a new client request, namely
ThisClient = New Client(MyTcpListener.AcceptSocket())
From the Debug menu, select the Processes menu item to launch the Processes dialog window. In this dialog window, make sure that Show system processes is selected, because the service is running under the LocalSystem account. In the Available Processes subwindow, double-click the ServiceAdmin process. If you can't find the process in the subwindow, check that the service is actually started. Figure 10-2 shows the service process highlighted.
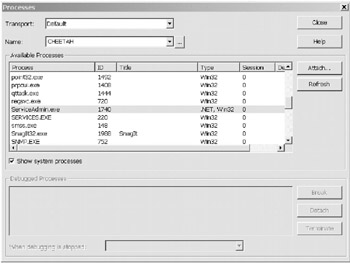
Figure 10-2: Attaching to the ServiceAdmin process for debugging
Attaching from Visual Studio
Once you've double-clicked the service process, Visual Studio presents you with the Attach to Process dialog window, which asks you which types of program you wish to debug. You should select the Common Language Runtime option and deselect all the others. If you also select the Native option, you'll find later that you may not be able to detach the debugger from the process. Unless you're using the Visual Studio Debugger Proxy service as described in Chapter 3, debugging native code means that you'll only be able to stop debugging by terminating the process. This is because the native debugger isn't designed to detach from a process.
Once the debugger has successfully attached to the ServiceAdmin process, you can close the Processes dialog window. Your breakpoint should be hit whenever the service receives a client request from a Web browser, so fire up your favorite browser and enter the URL http://localhost:5005/status.html . When you do this, you should find that your breakpoint is triggered immediately. At this point, you can single-step through the code and debug the Windows service just like any other application type. After you've finished investigating the code with the debugger, just press F5 and ServiceAdmin 's Web page showing the status of various Windows services should appear in your browser. If the browser experiences a time-out because you're investigating the code, you may need to refresh the page request by pressing F5 in the browser.
When you've finished debugging the service, simply go to the Processes window again, click the ServiceAdmin process in the Debugged Processes subwindow, and then click the Detach button. This causes the Visual Studio debugger to detach from the service process.
Ensuring the Correct Debug Settings
If you debug your service in this way, you have to make sure you have matching debug symbols for your executable and preferably that code optimization is switched off. This is described in detail in Chapters 3 and 4, and building your solution in the default debug configuration does all of this automatically. But what happens if you're trying to debug a release build of your Windows service?
First, you should always generate debug symbols, even for release builds. This means changing the release configuration for your project to generate debugging symbols by default. To do this, go to the ServiceAdmin project's Configuration Properties ’ Build property page, set the build configuration to Release, and make sure the Generate debugging information option is checked. Saving the solution will ensure that debugging symbols are always generated, even for a release build. You can also turn off JIT code optimization for a release build, though some developers think this is going a bit far because it can affect the speed of your program in some circumstances. If you want to do this, turn off the Enable optimizations option on your project's Configuration Properties ’ Optimization property page. There is, however, an alternative that gives you the best of both worlds : code optimization when running normally, but no code optimization while doing debugging. I described this technique in Chapter 4, but I'll repeat the description here to save you from having to refer back to that chapter.
If you place a configuration file (called MyApp .ini, where MyApp is the name of your executable) in the same folder as your.exe, it allows you to configure debug tracking and code optimization on a run-by-run basis. This is possible because the actual JIT compilation takes place at runtime rather than at compile time. The lines in the configuration file that control these settings are as follows (where 1 equals true and 0 equals false) :
[ .NET Framework Debugging Control] GenerateTrackingInfo=1 AllowOptimize=0
This allows you to override the settings that you specified when you originally built your service, and it's ideal for investigating those troublesome production problems that you're unable to find or duplicate during development and unit testing. As long as you make sure that the correct debug symbol (.pdb) file is available, you'll be able to step through source code and do full debugging without recompiling your Windows service.
Debugging a Service Without Installing It
The Visual Studio documentation insists that you install your service before you can debug it. During development of a Windows service, it can be a real pain to have to uninstall the previous version of the service and then reinstall a new version every time you want to test a change to your code. Fortunately, you can set up your code so that when using the Debug configuration it operates as a standard executable, and when using the Release configuration it reverts back to being a service.
To do this, you need to emulate what the Service Control Manager (SCM) does when it starts your service ”in other words, invoke your service's OnStart method. Listing 10-1 shows the code required for the ServiceAdmin service. The source lines marked in bold are the ones that you need to add to the standard code generated by the service wizard. These lines instantiate your service class and call its OnStart method. From there, the service can run quite happily within the IDE.
| |
' The main entry point for the service process <MTAThread()> _ Shared Sub Main() #If Debug Then Dim DebugService As New ServiceAdmin() DebugService.OnStart(Nothing) #Else Dim ServicesToRun() As System. ServiceProcess.ServiceBase ServicesToRun = New ServiceBase () {New ServiceAdmin} ServiceBase.Run(ServicesToRun) #End If End Sub | |
This approach also allows you to debug your Main procedure and the code in your OnStart method. This is otherwise rather tricky because these two procedures have already been executed (during service startup) before you get a chance to attach to the service process for debugging. If, additionally, you want to debug other service commands such as Stop or Pause , you can invoke the appropriate method from the Immediate window.
Debugging the OnStart Method
Sometimes the previous technique isn't applicable because you just have to debug your Windows service after it's been installed. This usually occurs when you have to solve specific security or other problems that don't show themselves when the service is running within the IDE.
The main problem with debugging the OnStart method is that you can't attach to your service process until after the service has been started, but at this point the OnStart method has already been executed. One trick is to sleep the service thread for 25 seconds at the very start of the Main procedure. This hopefully gives you enough time to rummage through the Processes window, find your process, and then attach the debugger to it. Unfortunately, even if you do manage this feat of speed, the SCM calls a time-out if your service doesn't start after 30 seconds and the service start is aborted. This leaves you just a few seconds for debugging!
If you really need the whole 30 seconds for debugging, or you don't care whether the service start is aborted as long as you can start debugging, there's a way to do this. The key is to have two services within your service application. This is allowed because multiple services can share the same process. You start a " dummy " service to launch the service process, and then attach to this process.
Add a breakpoint to your real service and use the SCM to start that service, and immediately your breakpoint should be hit. After debugging and before you do any proper release, you should, of course, remove the second service (and also its installer) from your Visual Studio solution.
Adding the dummy service to your application is easy. Just add a new service class and copy your real service class code into the new class so that you have a duplicate service. The only thing that you need to change in this dummy service is the service name. Then add an installer for your new dummy service by right-clicking its designer page and selecting Add installer from the drop-down menu. Make sure that the installer's service name matches your dummy service name. Finally, tell the application to start both services. In the ServiceAdmin application, the line of code in the Main procedure that starts the service is
ServicesToRun = New ServiceBase() {New ServiceAdmin()} After you add the new dummy service, the revised code that starts both services is
ServicesToRun = New ServiceBase() {New ServiceAdmin(), New DummyService()} That's all there is to it. Installing the application will install both your real service and the dummy service. Using the SCM to start the dummy service launches your application's process so that you can attach the debugger to it. From there you can start, stop, and otherwise debug your real service at your leisure. Just remember to remove the dummy service before you do any production release.
EAN: 2147483647
Pages: 160