Using the Visual Studio Debugger IDE
Now that you have a good understanding of how the Visual Studio debugger works, it's time to introduce you to some of the Visual Studio debugging windows . As you'll see, there is much more debugging functionality in Visual Studio .NET than in VB.Classic.
Using the Immediate/Command Window
This window is the equivalent of the VB.Classic Immediate window, but it now operates in one of two modes. The Immediate mode is for controlling your application. It gives you facilities similar to those provided in VB.Classic's Immediate window, allowing you to execute VB statements, evaluate expressions, and view variable values. The Command mode is for controlling Visual Studio. It allows you to execute Visual Studio commands directly, and even gives you access to commands that aren't on any Visual Studio menu. The current window mode, either Immediate or Command , is always displayed in the window title.
Switching Modes
To switch from Immediate to Command mode, enter >cmd . The greater-than (>) character is an instruction telling the window that what follows next is a Visual Studio command, not a VB expression. Once you are in Command mode, you will see the > character preceding all of your commands, in a similar manner to a DOS window.
To switch back from Command to Immediate mode, use the > immed command. At this point, the > character will disappear. If you want to issue a Visual Studio command while remaining in Immediate mode, simply prefix the Visual Studio command with the > character.
Using Immediate Mode
If you're using Visual Studio 2002, one of the first things you may notice about Immediate mode is that IntelliSense has disappeared. This is a disappointing regression from what was possible with VB.Classic. The good news is that if you upgrade to Visual Studio 2003, codenamed Everett during its beta phase, IntelliSense is back again. Even better, the IntelliSense prompt in Visual Studio 2003 tracks the most recently used member and defaults to that member. So if you type ?TextBox1.Text , then. Text will be the default text box member that pops up the next time that you use IntelliSense on TextBox1 . This can save you a surprising amount of time, especially because it's also implemented in the Source window.
One other major difference between the Visual Studio and VB.Classic Immediate windows is that when your program is in design mode, the Visual Studio .NET Immediate window can't evaluate any expressions. So whereas in the VB.Classic Immediate window you can enter the design-time expression ? 1+2 and expect to see the answer 3 , all you would see with Visual Studio is a helpful error message saying "The expression cannot be evaluated while in design mode". This happens because the VB.Classic Immediate window supports the VB interpreter when in design mode, but the Visual Studio Immediate window doesn't support the VB .NET language compiler unless your program is already running.
Provided your application is in break mode, the Immediate window operates in a very similar fashion to the VB.Classic Immediate window. You can print variable values and evaluate expressions using the question mark (?) character. For example, typing ? [object instance] gives you a tremendous amount of information about the object in question. Figure 3-4 shows the Immediate window during a debugging session.
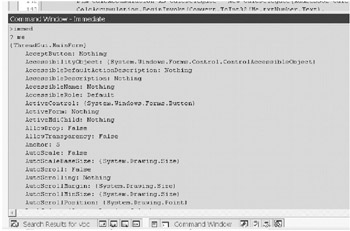
Figure 3-4: The Immediate window during a debugging session
You can also call any functions that are within scope, which gives you ample opportunity to add debugging hooks into your application. For instance, if you want to check the validity of the items within a collection, it's trivial to write a function to walk the collection and print any problems, and then call this function directly from the Immediate window.
This can be a very useful debugging aid, although there is a minor caveat. You should beware of invoking functions that call into unmanaged code or that block in some way, or that create a deadlock with code that is currently executing. In these cases you're unlikely to see correct function evaluation and you may cause Visual Studio itself to become unstable.
Using Command Mode
In Command mode, you have access to Visual Studio menu commands and macros. While this is very helpful for the keyboard-centric developer, perhaps the best feature is that you can alias commands down to a few letters . Visual Studio comes with its own predefined list of aliases; for instance, nf is the alias for the menu option File.NewFile , which brings up the New File dialog window. Another example is >immed , which is actually an alias for Tools.ImmediateMode . These aliases are a major help for those repeated lengthy commands that would otherwise need a fair amount of mouse movement or typing.
To view a list of current aliases, simply type >alias . To add an alias, type >alias followed by the command and any arguments taken by the command. To delete an alias, type >alias , then the name of the alias, and then /delete . Figure 3-5 shows the creation and deletion of an alias to open a text file using Notepad, followed by the creation of two aliases to control the start and end of Command window logging to a text file.
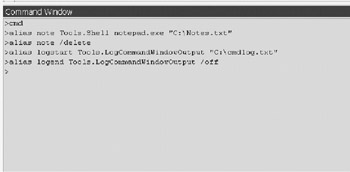
Figure 3-5: Aliasing in the Command window
Navigating the Immediate/Command Window
You can use the up arrow and down arrow keys to scroll through previous commands, but these keys do not move the cursor to previous commands like they did in the VB.Classic Immediate window. Instead, they repeat the previous command at the current cursor position, in a similar fashion as the up arrow and down arrow keys work in a console window. You can also select, copy, and paste text into the window (the documentation refers to this rather confusingly as Mark mode ). To do this, simply click a previous line in the window and perform the select, copy, or paste.
As a final tip, you can clear the Command/Immediate window with the >cls command.
Using the Output Window
The Output window is useful for recording the results of various Visual Studio operations. It is divided into multiple panes accessed from a drop-down menu at the top of the window. The most commonly used panes are likely to be the Build pane, which records the result of program build operations and any errors, and the Debug pane, which records output from the Debug and Trace commands, assertion failures, and module load/unload information. Figure 3-6 shows some of the information written to the Build pane after compiling a program.
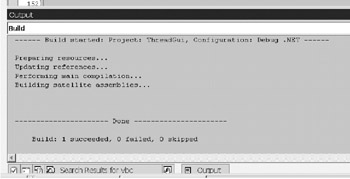
Figure 3-6: The Output window showing program compilation information
You can also tell batch files and other external tools that normally send results to the DOS window to instead send their output to custom panes in the Output window. You do this with the Tools ’ External Tools ’ Use Output window option. If you use SQL Server as part of your applications, the output from stored procedures that you call interactively using Server Explorer is also displayed in the Output window.
You can even use the Visual Studio automation facilities to write code to create your own Output window pane and then add to it any text you want. This could be useful, for example, when dividing your debug/trace reporting into different levels of severity.
Using the Source Window
VB .NET's Source window may look superficially similar to its VB.Classic ancestor , but this similarity conceals many new features.
DataTips in the Source window have been improved somewhat over their VB.Classic counterparts. In debug mode, if you hover the mouse over a variable, you can see its current value if it's in scope and its declaration if it's out of scope. You can also see a function's current return value, but only while that function is actually executing. Just as with VB.Classic, you can select and highlight any valid expression and see its value using a DataTip. This also works when evaluating properties, but not for function evaluations.
Just as with the Immediate window, the IntelliSense prompt in Visual Studio 2003 tracks the most recently used member and defaults to that member. So if you type ?TextBox1.Text , then. Text will be the default text box member that pops up the next time that you use IntelliSense on TextBox1 . This can save you a surprising amount of time, although this improvement is unfortunately not available in Visual Studio 2002.
Another excellent new feature of the Source window is the automatic compilation that goes on in the background. When the background compiler can't understand your code or finds a problem with the code, it puts a red squiggle underneath the offending area. If you hover over the squiggle or look in the Task window, you can see exactly what it's complaining about. Most of the comments are fairly comprehensible, although it can come up with the occasional strange message. Usually this is because it's prematurely analyzing some incomplete code, and completing the code makes the message go away. You can also perform a neat trick with background compiling. If you want to determine where in your code a certain method is called, simply comment out the method and you'll then see a red squiggle under every statement where that method is invoked. If you're using Visual Studio 2003, you can also set the Source window to show procedure line separators just like VB.Classic by going to the Tools menu and selecting the Options ’ Text Editor ’ Basic ’ VB Specific property page, then selecting the "show procedure line separators" option. Unfortunately, this option isn't available in Visual Studio 2002. If you're confused by the new Visual Studio key strokes for all of the old favorites such as single-stepping , jumping to and from a procedure, and so on, it's very easy to set all of these back to their VB.Classic equivalents. Go to the Visual Studio Start page (the House icon on the Navigation toolbar), select "My profile" and set the Profile setting to Visual Basic Developer.
Another improvement helps you to view source code easier. Pressing Ctrl-R twice toggles the line wrap in the Source window as well as several other IDE windows. This is very convenient when the automatic source indenting forces a line of code too far over to the right side of the window. If you really want to devote the maximum possible screen real estate to viewing and typing source code, the key stroke Shift-Alt-Enter maximizes the Source window and removes all of the other IDE windows. Repeating the key stroke returns the IDE back to its normal display. Figure 3-7 shows the maximized Source window.
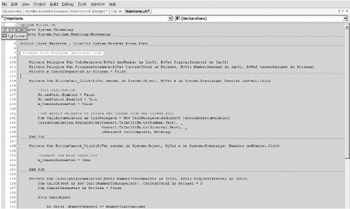
Figure 3-7: Source window maximized using Shift-Alt-Enter
It's easy to show line numbers for any source module. Simply go to Tools ’ Options ’ Text Editor ’ Basic ’ General and check the "Line numbers" option.
You can store fragments of source code for later copying and reuse by selecting the source you want to copy and simply dropping it onto the Visual Studio Toolbox. The source code is stored in the toolbox as a text item, and you can then easily paste it into another location.
Finally, you can create your own customized source comments. Go to Tools ’ Options ’ Environment ’ Task List and you can add to the system-defined TODO, HACK, and UNDONE comments. When you add one of these custom comments to your source code, it will show up automatically in the Comments view of the Task window. You can use the Task window together with the Source window to synchronize code with associated notes and tasks that need to be done. Typically you're juggling many mental tasks as you code and debug a program, and the Task window helps to reduce some of this mental workload.
Using Breakpoints and the Breakpoints Window
Breakpoints are at the heart of debugging and really bring the practice out of the Dark Ages. In olden times, a developer had to debug a program by sprinkling trace statements liberally through the source code and then indulging in fanciful postmortem speculation about how function XYZ coped with processing a three-dimensional array of nulls. Nowadays the modern streamlined developer can specify a breakpoint inside function XYZ that stops on the population of the fifteenth element of the second array dimension, and view exactly what value is causing the problem.
A breakpoint tells the Visual Studio debugger that it should pause the execution of an application at a certain point or when a certain condition is satisfied. There are three breakpoint types available within VB .NET. You will see a fourth type shown (the data breakpoint), but this is available only in native code.
-
File : Stops at a line within a specified source file
-
Function : Stops at the start of a specified function
-
Address : Stops when instruction at a memory address is reached
In their simplest form, these are all location breakpoints that pause a program when they are reached during program execution. In their more advanced form, the conditions under which breakpoints cause a halt in program execution can be modified to allow fine-tuning of your debugging.
You can set a file breakpoint by clicking to the left of a line of code in the Source window, or by pressing F9 when positioned on a source code line, or finally by right-clicking a line and selecting the Insert Breakpoint menu option. To set a function or address breakpoint, go to the Debug menu and select the New Breakpoint menu option. Figure 3-8 shows the New Breakpoint dialog window when a new function breakpoint is being added.
You can also disable breakpoints without actually removing them. This is very useful when you don't want to trigger a breakpoint at the current moment, but don't want to lose that breakpoint's position in case it's needed later.
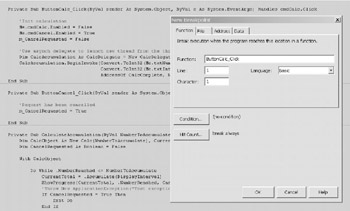
Figure 3-8: Adding a new function breakpoint
Using Simple Breakpoints
The simplest types of breakpoint are location breakpoints, of which there are three types.
Using a File Breakpoint
A file breakpoint specifies a break at a line and character position within a source file, and it is the only sort of breakpoint available to VB.Classic developers. The syntax that uniquely defines a simple file breakpoint is [Pathname and Filename, line xxx character x] . The pathname, filename, and line number are self-explanatory. You can normally leave the character number at the default of 1, but you could set it to a different number if there are multiple statements on a single line. You would then specify the character number that marked the beginning of the statement where you wanted the program to pause.
Using a Function Breakpoint
A function breakpoint is similar to a file breakpoint, but it is always placed at the beginning of a procedure. The syntax that uniquely defines a simple function breakpoint is [Namespace.Class name.Procedure name and signature] . Though at first sight, a function breakpoint just looks like a specialized file breakpoint, there is a subtle difference. A function breakpoint allows you to create child breakpoints easily. For instance, when you create a function breakpoint in a procedure that is overloaded or overridden, the debugger presents you with a list of all the corresponding procedures in your solution and asks you exactly where you want the function breakpoints to be placed. You can see an example of this in Figure 3-9.
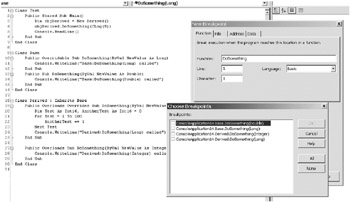
Figure 3-9: Adding a function breakpoint to an overloaded class member
Using an Address Breakpoint
You can set an address breakpoint from the New Breakpoint menu option on the Debug menu, which launches the New Breakpoint dialog window. An address breakpoint is a way of asking the debugger to break into your program when it hits an instruction at a specific memory address. Most VB .NET developers won't do any assembler-level debugging. My advice is that if you're trying to solve a problem that requires using one or more address breakpoints, you're probably going too deep. The problem with these forays into the darkest depths of memory is that they can take an inordinate amount of time and often raise more questions than they answer.
In most cases, it's significantly quicker and cheaper to work around the problem at the source level. Try using a different source construct or rewriting the code in question to work in a different manner, and resist the temptation to embark on a potentially endless chase through recursive rabbit holes. There's no way to make this type of quest sound like a good thing.
Using Advanced Breakpoints
You can set advanced breakpoints by adding one or two modifiers to the location breakpoints discussed previously. These modifiers allow you to fine-tune the exact behavior of a breakpoint so that you can go straight to a bug without having to track it down by laboriously single-stepping through your code.
Using the Hit Count Modifier
When the problem that you're investigating is happening inside a loop or in a procedure that's called many times, the hit count modifier allows you to specify that a breakpoint will only trigger after it's been hit a certain number of times. You can specify the number of times by clicking the Hit Count button in the New Breakpoint dialog window or the Breakpoint Properties dialog window. This button gives you a choice of selecting to break after a breakpoint has been hit exactly x times, x times or greater, or finally a multiple of x times. When the debugger stops at the breakpoint, the Breakpoints window will tell you how many times the breakpoint has been hit. Figure 3-10 shows this in action.
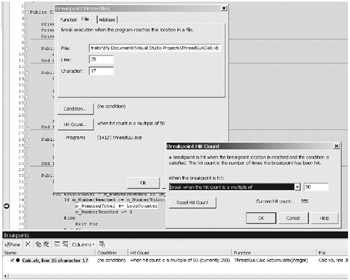
Figure 3-10: A breakpoint with a hit count modifier
This adds several tricks to your debugging arsenal. For instance, if you have a loop that's crashing but you don't know on which iteration the exception is occurring, simply set the hit count to a number larger than the maximum loop index. When the exception happens, looking at the Breakpoints window will tell you the number of times that the breakpoint was hit and therefore the loop iteration. Another tip is that if you always want a break to happen, but you still want to keep track of the hit count, set the hit count to break when it's a multiple of 1.
If you were accustomed to using skip count in the Visual Studio 6.0 debugger, you should note that single-stepping over a breakpoint now increments the hit count ”this behavior has changed since version 6.0.
Using the Conditional Expression Modifier
The second type of modifier for a location breakpoint is the conditional expression. This type of breakpoint is useful when you want the breakpoint to trigger only when the conditional expression that you specify evaluates to true , or alternatively when the evaluation of the conditional expression has changed since the last time the breakpoint was hit. One important caveat to be aware of is that the conditional expression is evaluated only when the breakpoint is actually hit ”some developers find it more intuitive to think of the expression being evaluated after every statement, but this of course is not correct.
You specify the conditional expression that you want the debugger to evaluate by clicking the Condition button in the New Breakpoint dialog window or the Breakpoint Properties dialog window. This button shows a dialog window that allows you to enter a conditional expression and specify whether the breakpoint should trigger when that expression evaluates to true or when the evaluation changes. Figure 3-11 shows a breakpoint that will only trigger if the Shift key is held down when the breakpoint is hit. This particular conditional breakpoint is useful when debugging events that contain drawing code, as discussed in Chapter 7.
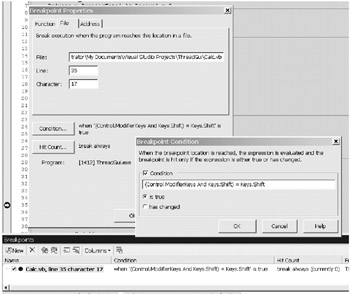
Figure 3-11: A breakpoint with a conditional expression modifier
All variables and functions within the current scope can be used in the conditional expression, including overloaded functions. Inheritance trees are fully supported within conditional expressions. So if you have an object Tiggles of type PersianCat , derived from type Cat , the expression Tiggles.Color will return the correct value for an object of type PersianCat .
There are some restrictions on conditional expressions. Local constants aren't supported for some reason. You should also be careful about including a function, as the function will actually be executed and any side effects of that function, such as changing a global variable, will be triggered. This can lead to your program changing state and producing unexpected results. The Visual Studio documentation provides a list of keywords that aren't supported in conditional expressions ”the most notable of these is probably AddressOf . Although you can use simple casts, casting using CType isn't supported. Using properties is supported, but as with functions, you should beware of causing unintended side effects. The final restriction is that you can't call a Web service method in a conditional expression.
You can combine a hit count modifier with a conditional expression modifier. This allows you to break whenever an expression is true , or has changed, for the n th time.
Developers often want to trigger a breakpoint as soon as a specific variable has changed its value. You can't use a conditional expression breakpoint directly to achieve this because it will only trigger when the breakpoint is reached and the variable has changed its value since the last time that the breakpoint was reached. One workaround is to put the variable in question inside a property, and then put a breakpoint inside the Set method of that property. The property has the effect of channeling all access to the variable through one breakpoint, and thereby enables you to trap the exact point when a variable changes in value.
Understanding Breakpoint State
A breakpoint can be in one of several states. Normally it is enabled, a state shown as a dark red circle in the appropriate window. This means that the breakpoint will trigger if the hit count or conditional expression is met.
You can also disable breakpoints without removing them, a state shown with an empty circle. In this state the breakpoint will never be triggered, but it will stay in view with the option of later being enabled.
A dark circle with an exclamation mark (!) symbolizes an invalid breakpoint. It means that the debugger can't set the breakpoint because either its location or its conditional expression is invalid. This can happen if Visual Studio picks up source file changes made outside of Visual Studio that make a current breakpoint invalid ”for instance, removing a line that moves a breakpoint onto a comment. It also happens if you specify an invalid conditional expression for that breakpoint.
A dark circle with a question mark (?) is warning you about a breakpoint that won't currently be hit. This usually happens when you set a breakpoint in source belonging to a DLL that won't be loaded until some point after the program has started. The debugger allows you to set these breakpoints in the source, but it isn't able to validate and set the actual breakpoint in the executable until the DLL in question has actually been loaded during the program run.
Finally, a full circle with a diamond inside stands for a mapped breakpoint. This is where you have set a breakpoint in ASP code and the debugger has set a corresponding breakpoint in the generated HTML page.
During a debugging session, the breakpoint marked in bold in the Breakpoints window is the one that caused the current pause in program execution. Figure 3-12 shows the Breakpoints window in action.
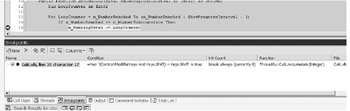
Figure 3-12: Using the Breakpoints window
Breakpoints are carried forward from session to session because they're stored in the solution's .suo file. This is a big improvement over VB.Classic, where you lost your breakpoints as soon as the current debugging session was closed.
Using the Watch Windows
A Watch window allows you to keep a close watch on variables or expressions that you think are important for whatever problem you're investigating. It's more specific than the Me, Locals, and Autos debugging windows that I discuss later, because you have full control over which variables and expressions are displayed in the window.
After breaking into an executing program or pausing it at a breakpoint, you can drag either a variable or a highlighted expression from the Source window to a Watch window, or you can type a variable name or expression directly into a Watch window. From this point on, the debugger continuously monitors and evaluates everything that you place in the Watch window. This is useful because many bugs can be tracked down to the execution of multiple interacting statements rather than just a single statement, so the Watch window helps you to keep an eye on important data as it flows through your code.
If a variable or expression in a Watch window drops out of scope during debugging, the Value column displays a message to this effect because it can't display the actual value. When you've finished debugging, all Watch variables and expressions are saved in the .suo file associated with a solution, which enables you to carry over your watches from one debugging session to the next.
There are four Watch windows available to you, which means that you can logically separate different parts of your debugging problem as you see fit. You can also use a Watch window to edit variable values directly, a facility that's very useful for checking multiple scenarios during a single testing run. Figure 3-13 shows some variables and expressions being evaluated in a Watch window during a debugging session.
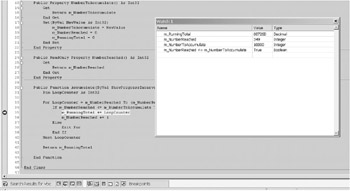
Figure 3-13: Using a Watch window
Be wary about the side effects of placing an expression into a Watch window, because it will be executed every time you step from one line to the next and the debugger re-evaluates the expression. If an expression, property, or method performs an action that you don't want to happen repeatedly, you should avoid placing it in a Watch window.
Using the QuickWatch Window
The QuickWatch window is the baby brother of the Watch window. It's a modal window suitable for evaluating just a single expression or variable, though it has a history list that you can use to repeat previous quick watches. Figure 3-14 shows this window in action.
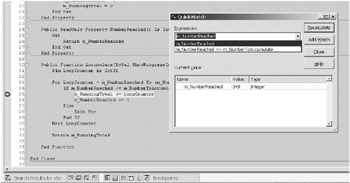
Figure 3-14: Using the QuickWatch window
Using the Locals Window
The straightforward and boring functionality of the Locals window is to display all variables local to the current context. Its more interesting functionality is to switch the current context temporarily so that you can look at other parts of the program.
You can switch context either by using the Debug Location toolbar to select a different function, thread, or stack frame, or by double-clicking a thread in the Threads window or a stack frame in the Call Stack window. To resume the current context after examining other contexts, simply step forward in the debugger and the Source window will switch back to the current context and continue execution as normal. It's fairly common for other parts of the program to be critical to the current context, so this ability to switch contexts while inspecting your program is very useful. Figure 3-15 shows the Locals window during a debugging session.
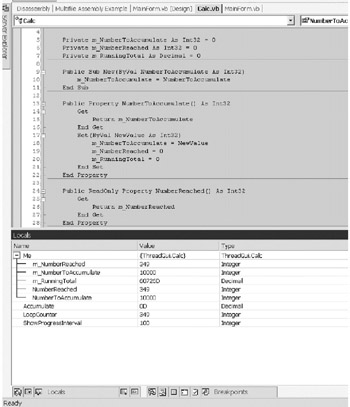
Figure 3-15: Using the Locals window
To view and modify variables in the Locals window requires the debugger to be in break mode. Although information does appear in the Locals window during program execution, this information won't be current until the program stops on a breakpoint or you choose to break the program using the Break All command on the Debug menu. The Locals window in Visual Studio 2002 shows any type of object member, but in Visual Studio 2003 the private members of an object instance are hidden.
One feature of the Locals window is that when stepping through your application, the value of any variable that has changed since the last debugger step is shown in red. You can also double-click a variable's value to modify it. This is useful when you want to test a scenario or correct a value without having to change code and restart your application.
Using the Autos Window
The Autos window is a minimal version of the Locals window. It displays variables that are part of the current statement and three statements before and after the current statement. You can edit the value of variables shown in this widow by double-clicking the Value column, but you should be careful about entering a valid value for the variable type and also about entering floating-point values that might be subject to decimal-to-binary conversion inaccuracies. Just like the Locals window, the Autos window in Visual Studio 2002 shows any type of object member, but under Visual Studio 2003 it doesn't show an object instance's private members. Figure 3-16 shows the Autos window during a debugging session.
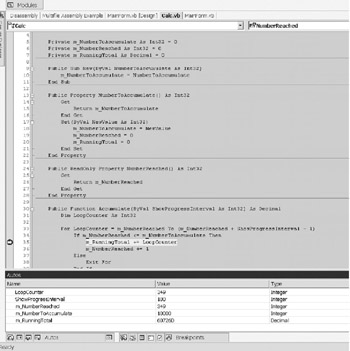
Figure 3-16: Using the Autos window
One useful feature of the Autos window is that when stepping over a function call, it shows the return value of that function and any other functions called by that function.
Using the Me Window
This is a convenient window that automatically displays the members of the current object instance. Like the Autos window, it allows you to edit the values of these members, with the same validity restrictions. Figure 3-17 shows the Me window in use during a debugging session.
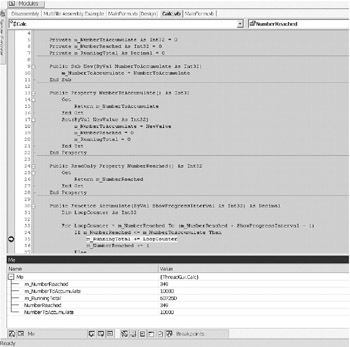
Figure 3-17: Using the Me window
Using the Call Stack Window
The Call Stack window shows you the list of active procedure calls within the thread that's currently executing. It's called a "call stack" because every time a method is called in your code, that method is pushed onto a stack held in memory. When that method finishes execution, it's popped off the stack, and so on for every method called within your application. Therefore, the call stack at any period in time always shows the list of procedures (otherwise known as stack frames ) for the currently active thread. If you have multiple threads within your program, you can use the Threads window to switch to a different thread, whereupon the Call Stack window shows the new thread's active call stack.
The Call Stack window is tremendously useful because it allows you to examine the context of any method shown in the call stack. In the Call Stack window, a yellow arrow shows the current execution point, and by default this is the method whose variables appear in your Watch, Locals, and Autos windows. If you right-click a different method and select Switch to Frame, you can view the code and data for that part of your program instead. This ability to switch methods is invaluable when you're deep down in a call stack but need to inspect the data and state of a procedure somewhere higher in the stack. This is a frequent requirement when you're investigating situations such as where a variable's value was changed or how various events interacted with each other. Figure 3-18 shows a typical call stack. The method calls shown in black are methods for which you have debug symbols.
When switching stack frames, you can see a green triangle against the new frame, but the execution point always stays in the current frame, as shown by the yellow arrow. If you step or continue, the program continues from the execution point, not from the frame that you're currently examining.
Selecting the Include Calls To/From Other Threads menu option from the Call Stack window's context (right-click) menu adds any method calls made to the current thread and by the current thread to another thread. If you're using Visual Studio 2003, the context menu also gives you an additional option called Show Non- user Code. This option displays method calls within the current stack for which you have no debug symbols, such as .NET Framework class methods. These method calls are shown in gray rather than the normal black. Other context menu options allow you to view method line numbers together with method parameter types, names , and values.
Finally, you can set function breakpoints directly from the Call Stack window, and then disable, enable, or remove these breakpoints during debugging. An active function breakpoint in the Call Stack window shows as a solid red dot in the left margin next to the method name.
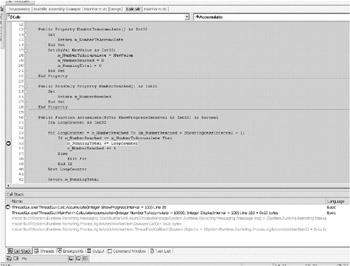
Figure 3-18: Using the Call Stack window
Using the Modules Window
The Modules window shows you extensive information about each of the components loaded by your application. Modules in this context include your application's executables, class libraries, control libraries, and dynamic link libraries (DLLs). Both managed and un-managed modules appear in the Modules window, in the order that they're loaded by your application.
This information is invaluable for finding component location and version issues. Because the Modules window shows the version, load path , and timestamp for every loaded module, it's easy to diagnose when the wrong module is being used, especially if you adopt the useful practice of assigning an identical version number and timestamp for every module in a release of your application. Because .NET can run different versions of the same component side-by-side, debugging version and location issues is likely to be more important than in the COM world. Figure 3-19 shows the Modules window in action.
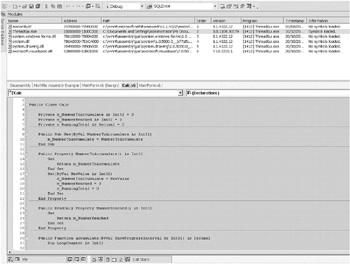
Figure 3-19: Using the Modules window
Perhaps the most useful information, especially when you do remote debugging, is the column showing whether a module's debug symbol file was loaded. As discussed previously, debug symbols are produced during language compilation and written to a file with a .pdb suffix. Without matching debug symbols for each component in your application, your breakpoints won't be triggered and you won't be able to do any real debugging. If the Modules window shows that the debugger hasn't loaded a module's debug symbols, you can tell the debugger where to find the correct .pdb file by right-clicking the relevant module and selecting the "Reload symbols" menu option. If you have a set of modules whose debug symbol files are all located in the same folder, you can select multiple modules together and go to "Reload symbols". At this point, the debugger asks you for a folder and then tries to match each of the modules with a corresponding debug symbol file.
To switch between looking at just the modules loaded for the current assembly and looking at the modules for every assembly in your application, you can toggle the "Show modules for all programs" context menu switch by right-clicking in the Modules window.
Using the Disassembly Window
The Disassembly window shows you the processor-native code being executed for each statement in your source code. Although this window is rarely useful for most VB .NET developers, it can come into its own if you're investigating a particularly low-level problem such as one related to code optimization. Figure 3-20 shows this window in action.
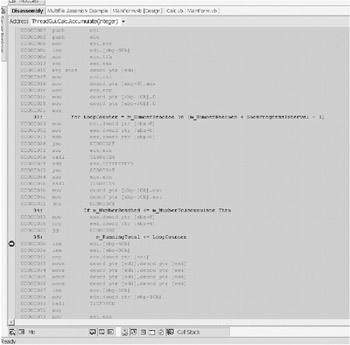
Figure 3-20: Using the Disassembly window
In my opinion, the Disassembly window would be more useful if it showed source code with corresponding CIL rather than native code. If you really want to do this, Chapter 4 presents a trick that makes it possible.
Using the Threads Window
When you debug a multithreaded program, the Threads window allows you to view, stop, and start each of the threads in your application. Please refer to Chapter 14, which covers the debugging of multithreaded programs, for a detailed guide to using this window.
Using the Running Documents Window
This window is useful for debugging script applications as it displays a list of documents that are loaded into the current process. Please refer to Chapter 9, which covers the debugging of Web and script applications, for a detailed guide to using this window.
EAN: 2147483647
Pages: 160
- Chapter III Two Models of Online Patronage: Why Do Consumers Shop on the Internet?
- Chapter V Consumer Complaint Behavior in the Online Environment
- Chapter XII Web Design and E-Commerce
- Chapter XIV Product Catalog and Shopping Cart Effective Design
- Chapter XVIII Web Systems Design, Litigation, and Online Consumer Behavior