Application Debugging
Although debugging SQL directly using Visual Studio or Query Analyzer is very useful, the most usual scenario involves debugging an application that's already written and that makes SQL Server calls from within its code. This section investigates SQL debugging from the point of view of an application running within Visual Studio and then the same application executing outside of Visual Studio.
Application Debugging Setup
Before investigating this example, you need to run the SQL setup script that accompanies this chapter. The first part of the script defines two tables, which are declared as shown in Listing 12-1. You'll use the table DebugTest as a test bed for inserting rows using a stored procedure, and the table DebugError will record any errors that happen while the stored procedure is executing. Notice the two constraints imposed on the KeyPrimary column of the DebugTest table. You aren't allowed to enter duplicate values into this column and any value that you do enter into this column must be greater than zero.
| |
/* Ensure we're in the right database */ USE pubs GO /* Build the first table */ CREATE TABLE DebugTest ( Id int NOT NULL IDENTITY (1,1), KeyPrimary int NOT NULL PRIMARY KEY CHECK (KeyPrimary > 0) ) /* Build the second table */ CREATE TABLE DebugError ( Id int NOT NULL IDENTITY (1,1), RowsInserted int NOT NULL, ErrorNumber int NOT NULL, ProblemValue int NOT NULL )
| |
The second part of the setup script is shown in Listing 12-2. This is the stored procedure that's going to be called by the test application every time it adds a new row to the DebugTest table. The stored procedure attempts to create a new row in the DebugTest table containing the value passed in the @KeyColumn parameter, and it then records any error that occurs in the DebugError table.
| |
/* Ensure we're in the right database */ USE pubs GO /* Build this stored procedure */ CREATE PROCEDURE sp_DebugExample @KeyColumn int AS /* Insert new row using parameter value */ INSERT DebugTest VALUES(@KeyColumn) /* Record any row insertion error that occurs */ IF @@error <> 0 BEGIN INSERT DebugError (RowsInserted, ErrorNumber, ProblemValue) VALUES (@@rowcount, @@error, @Keycolumn) END GO
| |
To build the tables and stored procedure for this debugging example, log into your favorite development SQL Server using a tool such as Query Analyzer, make sure that you're in the pubs database, and then run the setup script. It should report that everything completed successfully.
Application Debugging from Inside Visual Studio
Now load the VB .NET solution named SqlDebug . This solution contains the SqlDebug project that is going to call the stored procedure that you just built. The user interface for SqlDebug is shown in Figure 12-4. The Create connection command button makes a connection to the database, the Insert new row command button executes the stored procedure passing as a parameter the value that you specify in the text box, and the Destroy connection command button closes the database connection. The name of the database server to be used is hard-coded in the code behind the Create connection command button, so you need to alter this setting to correspond to the name of the database server that you wish to use. My database server is called Cheetah, but it's highly unlikely that yours has the same name!
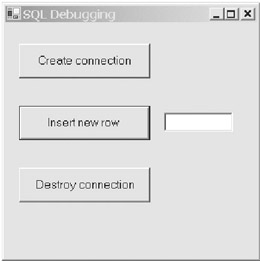
Figure 12-4: The user interface for testing SQL debugging
Before you do any SQL application debugging, you must ensure that you've told the project from which you're making the SQL Server connection that you're going to be doing SQL debugging. To do this, enable the SQL Server debugging option that you can find on the Properties ’ Configuration Properties ’ Debugging property page of the SqlDebug project. Failure to do this can result in a frustrating hour or two trying to decipher why your stored procedure breakpoints aren't being triggered. If you have another project in your Visual Studio solution from which you want to step into the project that's making the SQL Server connection, you need to enable the SQL Server debugging option for that project too. If you find that your stored procedure breakpoints aren't working during application debugging, these two option settings are the usual culprits.
Now prepare for debugging by using Server Explorer to connect to your favored database server and navigating to the sp_DebugExample stored procedure in the pubs database. Double-clicking the procedure opens a new tab in the Source window that displays the stored procedure's SQL code.
To start, run the application without adding any breakpoints in the stored procedure. Click the Create connection command button to make the database connection, and then specify the number 1 in the text box and click the Insert new row command button. Do this a few times, making sure that you enter a different nonzero number into the text box every time, without repeating any numbers . Then enter the following ad hoc query underneath the stored procedure:
SELECT * FROM DebugTest
If you select this query and choose the Run Selection option from the Database menu, you should see a listing of the rows that you've just inserted into the DebugTest table. So far, everything looks fine, so delete the ad hoc query that you just entered.
Now enter a number into the text box that you've already used, and click the Insert new row command button again. This time you'll see an error indicating that you've violated the unique constraint on the primary key. Answer OK to this error message and then enter a new ad hoc query underneath the stored procedure:
SELECT * FROM DebugError
If you execute this query as described previously, you can see that a row has been added to the DebugError table to reflect the problem that you just encountered . The only interesting fact is that the ErrorNumber column has a value of zero, which definitely doesn't look right. So now you have to debug the stored procedure to order to establish why it's not populating the ErrorNumber column with the correct value of the global variable @@error (2627 in this example).
Place a breakpoint at line 11 of the stored procedure. This is necessary because you can't step into a stored procedure from code; instead, you must use a breakpoint to trigger debugging. Then click the Insert new row command button again, using the same text box value as before. This time the debugger should stop on the breakpoint that you defined. Here you can check the @@error variable, which you can see is clearly nonzero. If you're using SQL Server 7.0 rather than SQL Server 2000, you won't be able to see the value of @@error , because version 7.0 unfortunately doesn't support most global variables . But as you can see from the path taken through the code, the value of @@error is definitely nonzero at this stage.
If you step forward one line, you can see that the value of @@error is now zero. What the original developer of this stored procedure overlooked is that when line 11 executes successfully the @@error variable is reset to zero. In fact, the only SQL statement that doesn't reset @@error is a declare statement. This is why the DebugError row insertion is inserting zero for the ErrorNumber column.
To fix this problem, you need to save the value of @@error before doing anything else. The corrected version of the sp_DebugExample stored procedure should look something like the code shown in Listing 12-3.
| |
/* Ensure we're in the right database */ USE pubs GO /* Build this stored procedure */ ALTER PROCEDURE sp_DebugExample @KeyColumn int AS Declare @error int, @rowcount int /* Insert new row using parameter value */ INSERT DebugTest VALUES(@KeyColumn) /* Save global variable state so that we don't lose it */ SELECT @error = @@error, @rowcount = @@rowcount /* Record any row insertion error that occurs */ IF @error <> 0 BEGIN INSERT DebugError (RowsInserted, ErrorNumber, ProblemValue) VALUES (@rowcount, @error, @Keycolumn) END GO
| |
After you've changed and recompiled the stored procedure, you'll need to close its Source window tab and load it again from Server Explorer if you want to continue debugging it. This time you should see that the new @error local variable contains the correct error number (2627) and that the ErrorNumber column is now populated correctly. As you can see, debugging a SQL stored procedure that's called from your application code is seamless, and you can step through SQL just like any other code. There are some specific debugging limitations with SQL, a list of which is presented later in this chapter.
Application Debugging from Outside Visual Studio
There are several cases where you might want to debug an application that uses SQL Server without having the application running within Visual Studio. For instance, you may be debugging a distributed application where the managed code is running on a machine different from your development machine and the SQL Server that it's using is on a separate database server. To debug this type of application, you need Visual Studio to attach to the managed process so that you can hitch a ride into SQL Server.
Restart the SqlDebug application without debugging, so that you won't hit any breakpoints. You do this by starting the application by pressing Ctrl-F5 rather than pressing just the F5 key. To prove that debugging isn't active, add a breakpoint anywhere in the sp_DebugExample stored procedure. Now when you use the application to connect to the database and insert a new row, you should see that the breakpoint isn't triggered.
Disconnect from the database using the Destroy connection command button. It's important that you disconnect before attaching a debugger, because you can't debug a SQL Server connection that's already active. Once the database connection has been closed, choose the Processes menu option from Visual Studio's Debug menu and locate the SqlDebug.exe process in this window. Select the process and click the Attach button. When the Attach dialog window appears, be sure to select both Common Language Runtime and Microsoft T-SQL as the program types that you want to debug. Once you've clicked the OK button, you should see SqlDebug.exe in the bottom pane of the Processes window. Now when you use the application to make the database connection and insert a new row, your breakpoint should be hit normally, showing that debugging is active. To detach from the process when you've finished debugging, click the executable in the bottom subwindow of the Processes dialog window and click the Detach button.
EAN: 2147483647
Pages: 160