The Nitty-Gritty of Taguchi Methods for Robust Design
| Robustness is a key concept in Taguchi Methods. Being "robust" may mean healthy, hefty, vigorous, strong, sturdy, and stout. Taguchi defines robustness as "the state where the technology, product, or process performance is minimally sensitive to factors causing variability (either in the manufacturing or user's environment) at the lowest unit manufacturing cost." It is the capability of a product or process to perform and meet customer requirements (for reliability, safety, security, and so on) despite the presence of various noise factors that may cause variability. A robust process or product performs as intended regardless of any harmful factors, called noise, that may be present. Noise is caused by variations of various kinds: environmental variation during customer usage of the product, manufacturing variation of individual units and components, and component variation due to aging and deterioration. The Concept of Signal-to-Noise RatioAccording to Taguchi, robustness should be addressed at the design and R&D stages. It implies a specific philosophical premise that true robustness can only be designed and built into a product or process rather than inspected and repaired. In other words, preventionrather than cureis its basic tenet. It also requires that quality problems be addressed upstream at the R&D, advanced engineering, and design stages, rather than during manufacturing and inspection, or, worse, after delivery to the customer. Taguchi Methods provide a cost- and time-efficient methodology to design and test products for robustness prior to manufacturing. These methods are also used for troubleshooting, redesigning defective processes, and problem solving of various kinds. We will now define some basic terms used in Taguchi Methods: Signal is what the product (or part or subassembly) is meant to deliver as its performance/functional characteristics. In a TV or phone, signals are what the product (TV or phone) delivers as picture or voice. A good signal is one that retains its quality despite noise (internal and external electromagnetic interference in a TV or phone). Noise is all the various factors that cause variation. Taguchi recognized that many noise factors such as customer usage (the single most common cause of variability), road conditions, and weather cannot always be controlled or eliminated. Noise is what causes performance/functional characteristics to deviate from their target quality. In general, there are three types of noise factors:
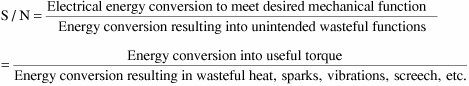
Noise causes products to operate out of specification or to fail completely. Product performance is dominated by unit-to-unit (inner) noise in early phases of the product life cycle, external (outer) noise in midlife, and deterioration (between-product) noise at the end of life. Robustness and Robust Design imply lack of sensitivity to noise factors in different phases of the product life cycle, even though these noise factors may not have been eliminated, only their effects neutralized. In a TV, some common noise is "snow" on the screen, lightning, a storm, fluctuating voltages, and other "nasty" operating conditions. In case of software, some key noise factors that cause variability are erratic customer usage, attackers and hackers, worms and viruses, accidental and malicious security breaches, lack of documentation, inadequate training, procedural breakdown, unauthorized access and use, and subjecting the system to uses that it was not designed for. Taguchi suggests that signal-to-noise (SN) ratio be used as a measure of quality.[12] He argues that SN ratio
For example, in an electromechanical device such as an electric motor, the SN ratio can be expressed as follows: In general, SN ratio in an engineering system such as a motor or generator can be expressed as follows: For software, it's transformation of information, data, images, and so on instead of energy/power. Robust Design in both software and hardware attempts to maximize the SN ratio for optimal design. The Concept of Quality Loss FunctionAs stated earlier, this concept is a major departure from the Western approach to quality. Taguchi addresses loss of quality, rather than the quality itself, and the implications of such loss to the customer, producer, and society at large. It is clearly implied that product quality incorporates more than reliability and that product cost incorporates more than just manufacturing and bill of materials costs. The customers expect reliability throughout the product life cycle, and cost optimization for the product life cycle is what matters eventually. Customers are increasingly demanding failure-proof delivery and performance. They expect various additional functional and convenience features. Finally, they are increasingly seeking consistent, high-quality, "on-target" performance, rather than accepting inconsistent performance within specifications. On-target performance may provide considerable cost and performance advantages for both the producer and customer. This constitutes one of the fundamental tenets of the Taguchi methodologies. Fowlkes and Creveling classify the life-cycle cost with respect to the following:[13]
Quality loss is defined as "loss imparted by the product to society from the time the product is shipped." This includes the loss to the company through costs of reworking, scrapping, maintenance, and downtime due to equipment failure and warranty claims. It also includes costs to the customer through poor product performance and reliability, leading to further losses to the manufacturer as its market share falls. There may be further loss to society if the product or service involves waste disposal, pollution, crime, safety, security, or health hazards. Taking a target value for the quality characteristic under consideration as the best possible value of this characteristic, Taguchi associates a simple quadratic loss function with deviations from the target value. The quality loss function shows that a reduction in variability about the target leads to a decrease in loss and a subsequent increase in quality. This function is used for design decisions on financial grounds to decide whether additional costs of improved quality will actually prove worthwhile in the marketplace. To the producer, the total costs can be expressed as follows:
Factory loss consists of scrap, rework, delay, and so on. Quality loss (QL) is the cost of product failure; it comes into the picture after products are shipped. It includes losses due to return, warranty, and repair, and loss of goodwill, resulting in loss of market share. QL can be huge even if the product is within specifications. It is 0 only if the product performance is exactly on target. Taguchi provides a rough-and-ready estimate for the quality loss function (QLF):
This expression is an approximation, not a "law of nature."[10] It is an engineer's tool, not a scientific law. It just implies that there is a "law of increasing costs" as the product performance deviates from the target. A general and accurate cost model is difficult to construct. One of the reasons for this difficulty is that a product may have different users and usage under differing environmental conditions. Taguchi suggests that individual corporations having better cost estimates may use those. But the preceding estimate of QLF is valuable as it is for the following practical purposes:
QLF and SN ratio are two measures of quality in Taguchi Methods. Both emphasize upstream/design activities, and both use customer measures such as dollar cost and performance/functional characteristics as evaluators of quality. As you will see in Chapters 16 and 17, they are related, and that provides a useful measurement in Taguchi methodologies. The Concept of Robust DesignTaguchi recommends the following strategy for Robust Design:
Robust Design using Taguchi Methods is carried out in the following three stages:
Chapters 16 and 17 discuss the Taguchi methodologies and how they can be adapted to software development. Their applications in the downstream phases of software development are presented in Chapters 18 and 19. |
EAN: 2147483647
Pages: 394