Using Reporting Controls in .NET
| Let's spend the remainder of this chapter discussing the standard reporting tools provided in Visual Studio. As mentioned earlier, there are two ReportViewer classes included in Visual Studio: one for desktop development and one for web development. I'll only be talking about the desktop variation in this chapter. The designer used to develop these reports does not differentiate between the report target (desktop or browser). There are some differences in deployment, but I'll have to leave the web deployment to a future best-selling programming book, or to your own research. The ReportViewer control integrates directly with Microsoft SQL Server Reporting Services, displaying whole pages generated by that server-based system. Because we're assuming that you are using SQL Server Express for your development (which does not include Reporting Services), I'll focus instead on the control's "local" mode presentation. This lets you display any data from any source you choose on each report display page, including SQL Server. And Now, the Bad News The ReportViewer control is not the easiest control in the world to use, but it's even harder to use when it doesn't even come with your copy of Visual Studio. If you are using Visual Basic 2005 Express Edition, you will not find the ReportViewer in your toolbox. Microsoft does make it available as a separate download (look in the download area of http://msdn.microsoft.com, the MSDN web site, for "Microsoft Report Viewer Redistributable 2005"), but that will only get you halfway. I'll be discussing a visual reporting designer later that is also not in the Express Edition. Although you can still manually create the XML content that is normally generated by the visual designer, that's no fun at all. If you are using the Express Edition, you can still use the project code in this book. You just won't be able to visually design new reports. But you can run the prewritten reports that I already included, because they are just XML content. If, after all of that, you are still an Express Edition user, please download and install the Microsoft Report Viewer Redistributable 2005 file from Microsoft's web site. In the vein of "those who can, do; those who can't, teach," let me walk you through the steps needed to visually design a simple report using the ReportViewer class. We'll create a report that lists the records in the Library Project's Activity table, a table that will have data in it even if you haven't used the Library program yet. This works best if you follow along in front of your computer, because reading about report design is a lot like reading about brain surgery: It's more interesting if you actually do it. Start by creating a new Windows Forms application. Add the Data SourceAdd a data source to the project that refers to the Activity database table. We already did this back in Chapter 10, "ADO.NET," in the "Creating a Data Source" section. Select the Data Figure 20-1. The LibraryDataSet as a data source, and as an XML ".xsd" file Add a Report Design SurfaceUse the Project Figure 20-2. Adding a new report to the project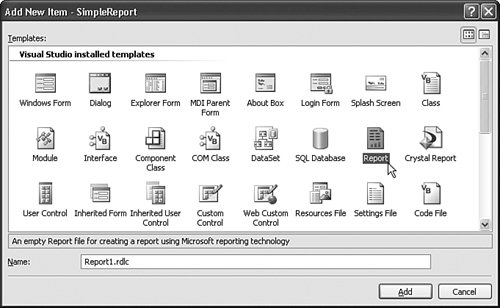 Click the Add button to insert the report into the project. A new Report1.rdlc file appears in your project, and its designer opens automatically. "RDLC" is short for "Report Definition Language - Client," and files of this type contain XML content that describes the layout of a locally designed report. Figure 20-3 shows the designer for the added Report1.rdlc file, plus the controls in the toolbar that you can add to the report surface. I will refer to reports created through this designer as "RDLC reports" throughout the rest of this chapter. Figure 20-3. The report designer and related toolbar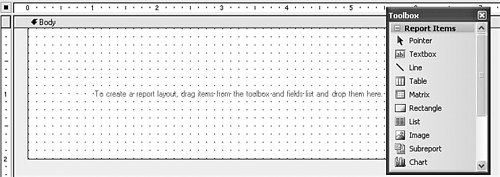 Design the Report SurfaceIf you've written reports in Microsoft Access or in some other common reporting tool, then you are probably familiar with "banded" reports. These reports have separate "bands," or stripes, that represent a portion of the printed page. Bands include page headers and footers, report headers and footers, the record detail section, and group headers and footers used to visually and logically group the detail entries. As the report runs, an imaginary horizontal page-wide line runs from the top to the bottom of the page. As the line hits each band, the report processes the fields in that band until there are no more records to process. RDLC reports are a little bit different from those banded reports. There are only three bands: page header, page footer, and everything else (a band called "Body"). Instead of adding bands for records and groups, you add fields to data regions. These special controls process the records linked to the report according to the shape of the data region. There are four data region controls in the toolbox.
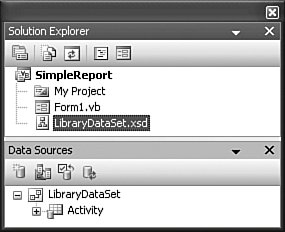
Records from data sets are always tied to a data region. If your report includes data from multiple distinct data sources, each data source will link to exactly one report region, and all regions appear in the Body band. We'll use a List data region for this sample report. Go ahead and add the List control to the Body band on the report surface. You can now add other items to either the band surface itself, or to the List control surface. Items added to the List control are reprocessed for each record in the incoming data source. These items can be either controls from the Toolbox, or database fields displayed in the Data Sources panel. Using the Activity table in the Data Sources panel, drag the FullName field to the List control surface. Figure 20-4 shows the display just after performing this drag operation. Figure 20-4. A List control with a field from the data set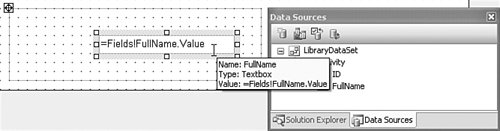 When we dragged the field from the data source to the List control, Visual Studio established a link between them. The list1 control's DataSetName field now refers to "LibraryDataSet_Activity," the name of the data source. It also added a TextBox control to the list's surface, and added an expression (=Fields!FullName.Value) that displays the contents of that field from the database for each processed record. I'm going to resize the List control, the text box, and the Body band itself so that the FullName text box field is pretty much all there is in the report (see Figure 20-5). Figure 20-5. A resized version of the reportThe report is ready to use. As we designed the report surface, Visual Studio was busy generating XML and storing it in the Report1.rdlc file. Using a Report ControlThe RDLC file is only an XML definition of a report; it doesn't have any ability to display itself. To view the report, we must add a report control to a form or web page that knows how to properly merge the XML design content with the data from the specified data source. Return to Form1, and add a ReportViewer control to its surface from the Toolbox (it's in the Data section of the Toolbox on my system). The added control includes a small "smart tags" button in its upper-right corner. Clicking this button displays the ReportViewer Tasks fly-out window, which appears in Figure 20-6. Figure 20-6. The ReportViewer control on the form surface The ReportViewer control presents a form-based experience for displaying reports. Most of the control is a blank area where the report appears. It also includes a toolbar used to navigate through the pages of the report. The user can also initiate an export or a print-out of the report through these controls. If you don't need the toolbar or one of its controls, use the various Show...properties of the ReportViewer control to hide the unneeded elements. The report viewer is generic and report-independent. If you have several RDLC files in your project, you can display any of them (one at a time) through the same report viewer. We have only one report in our project, so let's connect it (SimpleReport.Report1.rdlc) to the viewer by using the Choose Report task from the report viewer's smart tag button. Also, click on the Dock in parent container task in the fly-out window to expand the report to the form's size. The RDLC report, the data from the data source, and the ReportViewer control are all joined in one glorious report display by the magic of data binding. When you linked the report to the viewer control, three more controls appeared on the form: LibraryDataSet, ActivityBindingSource, and ActivityTableAdapter. LibraryDataSet is a reference to the actual data source we added earlier. The other two controls wrap up that data in a form that can be bound to the report viewer. Although you can't see it in the designer, the hidden form code connects these controls and the XML report to the viewer. ReportDataSource1.Name = "LibraryDataSet_Activity" ReportDataSource1.Value = Me.ActivityBindingSource Me.ReportViewer1.LocalReport.DataSources.Add( _ ReportDataSource1) Me.ReportViewer1.LocalReport.ReportEmbeddedResource = _ "SimpleReport.Report1.rdlc" Yeah, I don't really get it either. But that's okay. Visual Studio connected it all up for us. Run the ReportPress F5 and see the results of your efforts. In Figure 20-7, I adjusted the view by clicking on the Page Layout button, and setting the size to 100%. Figure 20-7. Reporting the essential contents of the Activity table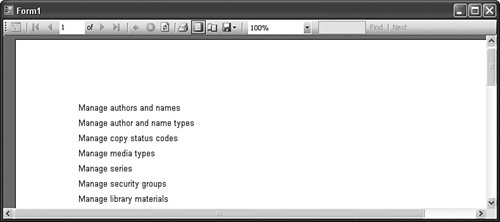 Well, that report is fine as far as Activity table reports go, but we could spruce it up a bit more. Adding a Page Header and FooterI think the report needs a meaningful title at the top of each page, plus a page number in the bottom-right corner. Let's return to the RDLC report designer and add them. Once there, right-click on the background of the report (not the body, which has the grid marks on it), as shown in Figure 20-8. Figure 20-8. Adding page headers and footers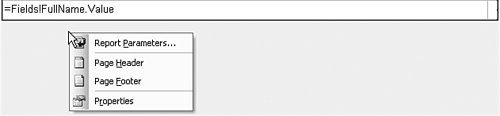 From this menu, select Page Header; then bring up the menu again and select Page Footer. Each new band appears on the report surface. Whether it's static, unchanging text, or text that's dynamically generated from the data source, the TextBox control is the control of choice for showing text content. Add a TextBox control from the Toolbox to both the header and footer sections. Click inside the header's text box, and type the following: ="The Activity Table Report" You can use the Properties panel to adjust the look of this control, including its display font. In the footer text box, add this text: ="Page " & Globals!PageNumber The Globals pseudo-object includes a few members that you can use in the report. How did I know to use Globals!PageNumber? I built the expression visually using the Expression Editor. To access it, right-click on the TextBox control, and select Expression from the shortcut menu. The editor, shown in Figure 20-9, lets you build up an expression using lists of functions and field names. The actual functions just happen to behoorayVisual Basic functions. Figure 20-9. The Expression Editor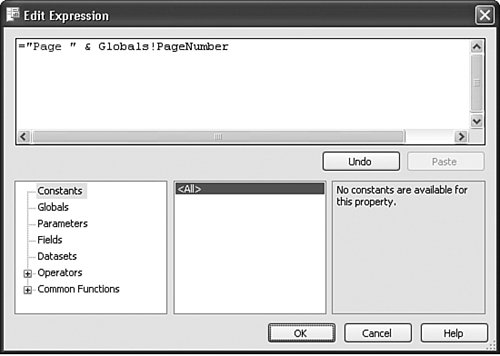 Support for Grouping and SortingGrouping of data is common in printed reports. To add grouping to our report, we need to embed our existing List control (the detail record) within another List control (the group), and set various properties on the group List control to determine the method of data grouping. Let's try it. Add another List control (called list2) to the report body, and give it twice the height as the existing List control (called list1). Then, drag list1 (the detail record) into list2 (the new group), placing it toward the bottom. Your report should look like Figure 20-10. Figure 20-10. A grouping list added to the report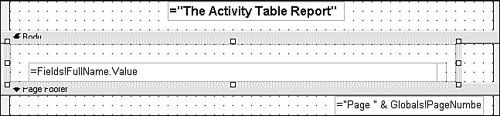 To configure the group, right-click on it and select Properties from the shortcut menu. The List Properties form appears. On its General tab, click the Edit details group button, which sets the grouping. On the Grouping and Sorting Properties form that appears, enter the following text into the first row of the Group on field. =Left(Fields!FullName.Value, 1) This expression tells the list2 control to group its detail results by the first character of the first name field. On this same form, add the following text to the Document map label field. ="Letter: " & Left(Fields!FullName.Value, 1) The document map enables a clickable hyperlink list into the different groups of the report. When we run the report a little later, we'll see this map just to the left of the report display surface. The records in the Activity table are ordered for the convenience of the programmer (me). But the report user probably wants to see them sorted in some reasonable fashion. Click on the Sorting tab, and add the following text to the Sort on field, in the Expression column. =Fields!FullName.Value As expected, this will sort the data by the FullName field. Click the OK buttons all the way out, and return to the report surface. We still need to add something that will make each group stand out. Add a TextBox control to the list2 grouping control. Put it in the upper-left corner of that parent control, and type the following text into it (or into its Value property). =Left(Fields!FullName.Value, 1) I also set its BackgroundColor property to "Black," its Color property to "White," and its Font property to "Normal, Arial, 12pt, Bold" just for looks. Running the report gives the results in Figure 20-11. Notice the document map along the left-edge of the window, and the grouped single-letter titles before each grouped section. Figure 20-11. The full report, with grouping and sorting enabled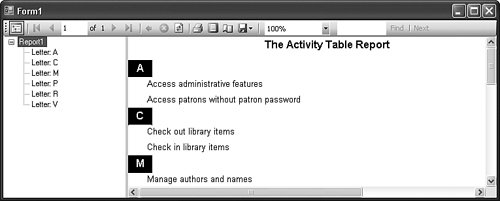 Enhanced Style FormattingProbably the coolest feature of RDLC reports is that many of the properties for items placed on the report surface can include conditional expressions. This means that you can conditionally alter, say, the visual properties of a TextBox control based on the value of a field in the current record. In the project section of this chapter, we'll write a report that uses due dates for items currently checked out. If the item is past due, I want to show the due date in red. Normally, a TextBox control's Color property (which controls font color) is "Black." To have that field respond to overdue items, I will replace "Black" with the following expression. =IIf(Fields!DueDate.Value < Today, "Red", "Black") Using Custom DataAlthough it is very common to generate reports from databases, you can actually use data from virtually any source. When using the ReportViewer control, any data source that implements the IEnumerable interface is good enough. That includes all collections and arrays. The report isn't that picky, as long as the data is formatted as it expects. For the report we just made, we can ditch the actual data, and supply our own fake data. This intercepting and substituting data is like something out of a spy thriller. But there are a few rules we must follow to make it work.
Those rules aren't so bad. So here's what we need to do: Create a fake data source, intercept the report just before it tries to get the data from the Library database, and insert our own data instead. For a fake data source, we'll need a class that includes at least the FullName field. Public Class FakeActivityRecord Private StoredID As Long Private StoredFullName As String Public Sub New(ByVal whatID As Long, _ ByVal whatFullName As String) StoredID = whatID StoredFullName = whatFullName End Sub Public Property ID() As Long Get Return StoredID End Get Set(ByVal value As Long) StoredID = value End Set End Property Public Property FullName() As String Get Return StoredFullName End Get Set(ByVal value As String) StoredFullName = value End Set End Property End Class The exposed fields must be properties, and not just public fields; the report viewer doesn't recognize standard member fields. If you look at the source code for Form1, you'll find that the following code was added to the Form_Load event handler when we linked the report viewer with the RDLC report. Me.ActivityTableAdapter.Fill(Me.LibraryDataSet.Activity) Me.ReportViewer1.RefreshReport() It's that first line that loads the data from the Library database's Activity table and links it to the report. We need to replace that line with code that cuts off the real data at the pass. ' ----- Create a fake table of fake records. Dim fakeSource As New Collections.Generic.List( _ Of FakeActivityRecord) ' ----- Add each of the fake records. fakeSource.Add(New FakeActivityRecord(1, "Do some work")) fakeSource.Add(New FakeActivityRecord(2, "Take a nap")) fakeSource.Add(New FakeActivityRecord(3, "Write a program")) ' ----- The report was already bound to the true ' data source. Delete it. Me.ReportViewer1.LocalReport.DataSources.Clear() ' ----- Build a new data source. Remember, it must have ' the same name. Dim fakeReportSource As New _ Microsoft.Reporting.WinForms.ReportDataSource fakeReportSource.Name = "LibraryDataSet_Activity" fakeReportSource.Value = fakeSource ' ----- Connect the data source to the report, and we're done. Me.ReportViewer1.LocalReport.DataSources.Add(fakeReportSource) Me.ReportViewer1.RefreshReport() Figure 20-12 shows the report with the fake data on display. Figure 20-12. This fake data will not self-destruct in five seconds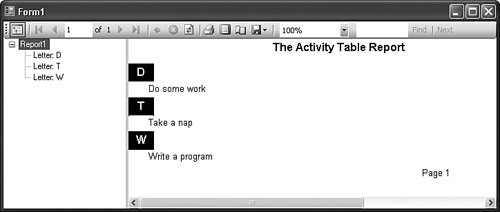 Supplying Custom Data SourcesSubstituting data at the last second is fine and all, but what if you want to design a report that doesn't depend on a database at all? You can do that, too, by supplying a fully custom data source. RDLC reports require some sort of data source schema at design time; you just can't supply fully custom data on the fly when running the report. But you can supply a custom schema based on a class in your application. For the class, we'll stick with the FakeActivityRecord we created in the previous section. Then we will design a data source from this class. Select the Data Figure 20-13. Creating a data source based on a custom object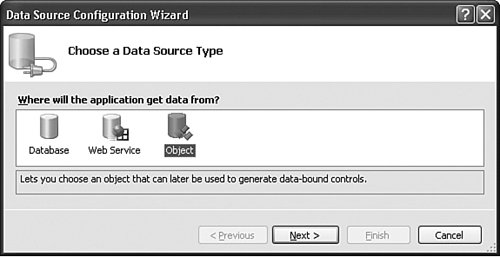 When you click the Next button, a hierarchy of all the classes in your application appears. Expand the classes, and then locate and select the FakeActivityRecord class. Click the Finish button. FakeActivityRecord now appears as a data source in the Data Sources panel. Now you can drag-and-drop this data source's FullName field onto a new RDLC report design surface. Add a new report to your project, and follow the same steps we used previously to design the first report. This time, use the FakeActivityRecord data source instead of the LibraryDataSet source. To test this new report, I removed the original Form1 from the project and added a brand new Form1. I also added a ReportViewer control to its surface and docked it, but I did not link it to the RDLC report. This keeps things a lot cleaner, as there are no binding source controls and whatnot to worry about. Then I added this code to the form's Load event handler. ' ----- Link to the RDLC report design. Me.ReportViewer1.LocalReport.ReportEmbeddedResource = _ "SimpleReport.Report2.rdlc" ' ----- Create a fake table of fake records. Dim fakeSource As New Collections.Generic.List( _ Of FakeActivityRecord) ' ----- Add each of the fake records. fakeSource.Add(New FakeActivityRecord(1, "Breakfast")) fakeSource.Add(New FakeActivityRecord(2, "Lunch")) fakeSource.Add(New FakeActivityRecord(3, "Dinner")) ' ----- Build a new data source. Remember, it must have ' the same name. Dim fakeReportSource As New _ Microsoft.Reporting.WinForms.ReportDataSource fakeReportSource.Name = "SimpleReport_FakeActivityRecord" fakeReportSource.Value = fakeSource ' ----- Connect the data source to the report, and we're done. Me.ReportViewer1.LocalReport.DataSources.Add(fakeReportSource) Me.ReportViewer1.RefreshReport() It's pretty similar to the previous custom code, although the data source name is now "SimpleReport_FakeActivityRecord," the name this new report expects (which I found out by running the report and reading the error message). I've saved a copy of both custom reports in the installation directory for the book's source code samples. Look in the subdirectory named SimpleReport. |
EAN: 2147483647
Pages: 247