Performance Tools
In addition to a full set of new management tools, SQL Server 2005 also provides an updated set of tools for analyzing and improving server performance. In the five years since the last release of SQL Server, Microsoft has been able to add a lot of functionality to the management tools provided with SQL Server, and as you’ll see in this section, the performance tools are no exception. In this section, you’ll get a look at four of the most important new performance management tools included in SQL Server 2005: the SQL Server Management Studio Query Editor’s graphical Showplan, the Database Tuning Advisor, and last but not least, Profiler.
SQL Server Management Studio Query Editor: Execution Plans
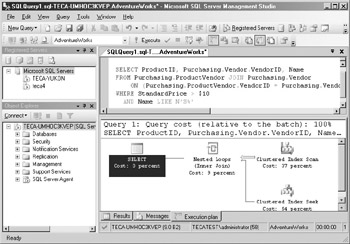
Like the old Query Analyzer, the new Query Editor has the capability to graphically display the execution plan for a query. The new SQL Server Management Studio Query Editor also extends this capability by enabling you to display an estimated execution plan as well as the actual execution plan. You can see a sample execution plan in Figure 2-7.

Figure 2-7: Query Editor Showplan
Some of the new features that have been added to the Query Editor’s graphical Showplan include a new set of redesigned icons that are more intuitive. The new color coding follows a set pattern. All iterators are blue, cursors are yellow, and SQL language constructs are green. Parameter values that were used for parameterized queries will be displayed in the Showplan. There’s improved information for queries that were executed in parallel where the Showplan can show how many rows were produced by each thread. In addition, the new Showplan information will also show when CLR user-defined extensions (UDX) are used as part of a query.
Exportable XML Showplan
Unlike the old Query analyzer, the Query Editor also has the ability to export the Showplan results as an XML document. This Showplan XML document can then be imported by Microsoft support or other technical support personal to troubleshoot query performance issues. The generated XML Showplans are schema validated, and the new XML Showplan format is easily portable and can be e-mailed to a remote site for review. It can be imported and graphed by a remote user without requiring access to the source database. Using the XML format for the Showplan output provides some nice advantages over the text and graphical formats. It can be processed using any XML technology, such as XQuery, XPath, DOM, or SAX. If you support mobile databases, one additional nice touch is that SQL Server CE uses the same format. One important point to note is that while the new export to XML format is available, you don’t necessarily need to use it. The older text and graphical Showplan formats are still supported.
Database Tuning Advisor
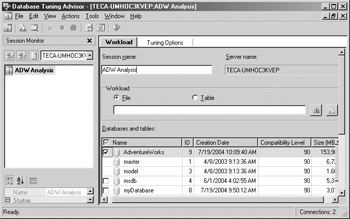
The Database Tuning Advisor is another new feature that’s bundled in SQL Server 2005 to enable you to fine-tune the performance of your database applications. The Database Tuning Advisor is essentially an updated version of the Index Tuning Wizard that was provided in the earlier releases of SQL Server. However, the new Database Tuning Advisor goes far beyond just suggesting new indexes, and that’s one of the reasons for its new name. The Database Tuning Advisor is able to work with partitions; it supports scheduled execution, as well as improved evaluation what-if analysis. The other reason is the fact that the new Database Tuning Advisor is now a full-fledged application rather than just a series of wizard dialogs. You can see an example of the Database Tuning Advisor in Figure 2-8.

Figure 2-8: Database Tuning Advisor
Partitioning Recommendations
In addition to recommending indexes, the new Database Tuning Advisor provides full support for SQL Server 2005 data partitioning. The Database Tuning Advisor can recommend the use of both aligned and nonaligned partitions. (An aligned partition uses a clustered index that’s in the same order as the table, while a nonaligned partition uses a non-clustered index that’s in a different order than the base table.) In addition to being able to recommend adding partitions, the Database Tuning Advisor can also recommend dropping existing partitions. You can refer to Chapter 2 for more information on data partitioning in SQL Server 2005.
Pause and Resume
The old Index Tuning Wizard, like a typical wizard application, operated in a one-time run mode where you stepped through the wizard screens from start to finish. The new Database Tuning Advisor, by contrast, can be stopped and restarted with the saved state. You can even resume the state on different client workstations.
Scheduled Tuning
The Database Tuning Advisor supports a couple of different scenarios for scheduled tuning. First, unlike the old Index Tuning Wizard, which could run for long periods of time while it came up with the optimum index recommendations, the new Database Tuning Advisor can be set up to run for a specified amount of time and then deliver a “best effort” tuning recommendation based on the given run time. If the old Index Tuning Wizard wasn’t allowed to finish, it was unable to generate any recommendations. In contrast, you can set up the Database Tuning Advisor to run for four hours and give the best recommendation that it can given what it was able to accomplish in the allotted time. In addition, the Database Tuning Advisor has the ability to schedule its runs without the need to run the tool interactively or to perform the scheduling using difficult scripting.
What-If Tuning
Another cool new feature of the Database Tuning Advisor is the ability to perform evaluative or what-if tuning. This feature allows you to test a given run scenario in terms of selective testing of its recommendations. For instance, if the Database Tuning Advisor recommended that you add four different indexes but you felt that you didn’t really need all four, you can rerun the work load using your chosen indexes and then see how your choice compares with the Database Tuning Advisor’s original recommendations.
Profiler Enhancements
While certainly not a new feature, Profiler has been given a number of enhancements in the new release. One of the most fundamental changes in Profiler is found at the architectural level. Profiler is closely tied to the SQL Server engine, and in previous releases when updates were applied to the SQL Server engine that affected the information used by Profiler, a corresponding update needed to be applied to the client systems that were used to run Profiler. With the SQL Server 2005 release, Microsoft has extracted the definition of valid events and columns from the SQL Server engine and stored them in XML files. When Profiler first starts, it checks the version of SQL Server that it’s connecting to. If Profiler connects to a known version of SQL Server, then it uses its cached definitions. If it connects to an updated version of SQL Server, then it downloads the new XML profiling information. This enables Profiler to seamlessly work with updated versions of SQL Server without requiring updates to the Profiler client each time an update is applied to the SQL Server engine.
Profiling Analysis Services
One of the biggest changes in Profiler for SQL Server 2005 is its ability to profile MDX statements that are run against Analysis Services. The new Profiler can work against a SQL Server 2005 Analysis Services instance in exactly the same way that it has worked with the relational SQL Server engine in previous releases.
Aggregated Views
The aggregated views feature of the new SQL Server 2005 Profile enables you to group events together and show the total number for the entire grouping. For instance, you could choose to view the profiler events according to system process ID (SPID) and the Login Event and see the total number of failed logins by a particular SPID. This feature can enable you to more easily see important trends and events without requiring you to take the Profiler’s output, store it in a table, and then perform queries against it.
New Trace Permission
Another important enhancement in SQL Server 2005 that directly affects Profiler is the new Trace permission. With earlier releases of SQL Server, you needed to be a System Administrator in order to run Profiler. While that wasn’t a problem for most normal performance troubleshooting activities, it did prove to be a hurdle for running audits where you didn’t necessarily want to give the auditor full system administrative privileges. SQL Server 2005 includes a new Trace role that you can assign to a login, giving that login the ability to run Profiler without being a member of the system administrator’s group. Obviously, because Profiler potentially allows access to all of the data, you need to be very careful about granting the Trace permission.
Data Extraction by Event Type
The new SQL Server 2005 Profiler is also able to extract information from the Profiler output according to event type. For instance, this feature enables you to extract all of the T-SQL statements from a given Profiler session and then write those events as a .sql file that can be executed using SQL Server Management Studio. Profiler provides this same capability for MDX and DMX statements as well. Another really cool use for this feature is the ability to extract deadlock information. This deadlock information can then be presented in the graphical view using Profiler.
Create Trace Wizard
Another new feature that’s found in SQL Server 2005 is the reintroduction of the Trace Wizard. The Trace Wizard was originally introduced in SQL Server 7 but was subsequently dropped from the SQL Server 2000 release. Microsoft has added the Create Trace Wizard back into SQL Server 2005. Essentially, the Create Trace Wizard makes it easier to run Traces by walking the administrator through common trace scenarios.
EAN: 2147483647
Pages: 80