Rails Cookbook
Authors: Orsini R
Published year: 2007
Pages: 160-161/250
Buy this book on amazon.com >>

Recipe 10.10. Debugging HTTP Communication with Firefox Extensions

Problem

You need to examine the raw HTTP traffic between a browser and your Rails application server. For example, you're developing features of your Rails application that use Ajax and RJS templates, and you want to examine the JavaScript returned to each XMLHttpRequest object.

Solution

Firefox has a number of useful extensions that let you examine the underlying HTTP communications between your browser and the server. One of these tools is Live HTTP Headers. This extension lets you open up a secondary window so you can see the HTTP communication in a Firefox window.

You can get Live HTTP Headers from http://livehttpheaders.mozdev.org/installation.html and install the Firefox extension.

If Firefox tells you that the site is not authorized to install software on your computer, simply click Edit Options, which opens a dialog box in which you can specify what to allow. In this case, allow livehttpheaders.mozdev.org to install the extension by clicking Allow in the dialog box; then try again to install the extension. You'll have to restart the browser to complete the installation.

Once you have the extension installed, use it by selecting "Live HTTP headers" from the Tools menu in Firefox. This opens the output window; you can start watching your HTTP header traffic by selecting the Headers tab. Unfortunately, Live HTTP headers only lets you examine the headers of requests and responses. If you need to see the content of an XMLHttpReques t response, use FireBug.

Install FireBug directly from https ://addons.mozilla.org/firefox/1843. Once the extension is installed and you've restarted Firefox, open FireBug by selecting Tools FireBug Command Line. This splits your current Firefox window into two parts . The lower portion opens to the FireBug console pane. To view XMLHttpRequest traffic in the Console tab, you have to make sure it's checked in FireBug's Options menu. Now when your application sends XMLHttpRequest s to a server, you'll see each request in FireBug. Expand each one by clicking on the left arrow to view the Post, Request, and Headers.

Discussion

Before Firefox came along, with its many extremely helpful extensions, developers would use command-line tools such as curl or lwp-request to examine HTTP communication. But if you've ever tried sending an email using Telnet, you'll really appreciate how easy it is to do HTTP inspection with the Firefox extension in this recipe's solution.

Figure 10-1 shows a typical session in the Live HTTP Headers output window.

Figure 10-1. A Live HTTP Headers window showing HTTP traffic during a browser session

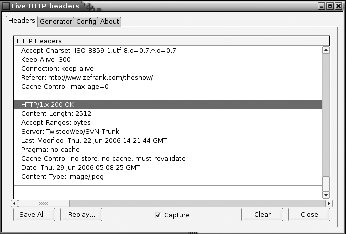
Figure 10-2 shows a Rails application that stores appointments entered into a database. When the user clicks "schedule it!," an XMLHttpRequest is initiated. This request can be seen in the FireBug Console tab.

Figure 10-2. The FireBug console tab showing XMLHttpRequest traffic
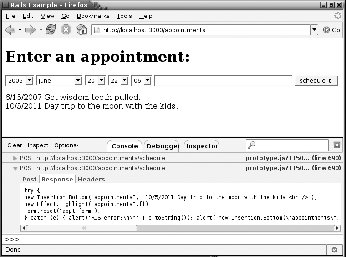
See Also

  • The Hypertext Transfer Protocol at http://www.w3.org/Protocols


Recipe 10.11. Debugging Your JavaScript in Real Time with the JavaScript Shell

Problem

You want to debug the JavaScript of your Rails application interactively. For example, you want to test JavaScript that manipulates the DOM of a page and see the results immediately.

Solution

The JavaScript Shell is a great tool for interacting with your application's JavaScript. It's available from http://www.squarefree.com/shell. To install the bookmarklet, look for the one called "shell" on http://www.squarefree.com/bookmarklets/webdevel.html, and drag it onto your bookmarks toolbar.

To use it, open a web page in Firefox, click on the shell bookmarklet, and the JavaScript Shell window will open in another window. Within this window you can execute JavaScript and manipulate elements of the original web page you were viewing.

For example, let's say you have a web page called demo.html that contains the following HTML:

~/Desktop/demo.html :

<html>
  <head>
    <title>JavaScript Shell Demo</title>

    <script type="text/javascript" src="prototype.js"></script>

    <style>
      .red {color: red;}
    </style>

  </head>
  <body>

    <h2 id="main">JavaScript Shell Demo</h2>

    <div id="content">Demo Text...</div>

  </body>
</html>

While viewing the page in Firefox, click on the shell bookmarklet and a pop-up window will appear. Within that window you can start typing JavaScript commands interactively. From this window, you can create variables containing element objects and then start playing with the properties of those objects, such as altering style elements or triggering script.aculo.us visual effects.

Figure 10-3 shows what demo.html looks like, along with the JavaScript Shell window you get with the bookmarklet. Because demo.html includes the Prototype JavaScript library, you have the methods of that library available to you in the JavaScript Shell. For example, $('content') is the same as getElementById('content') and is used to return a div element object, which you can manipulate any way you want.

Figure 10-3. The JavaScript Shell, opened with a bookmarklet, interacting with its parent window

Discussion

The JavaScript Shell is an extremely useful tool for inspecting and experimenting with the JavaScript of a page in real time. It's most useful when run as a Firefox bookmarklet.

The JavaScript Shell enables you to inspect the JavaScript environment of your application, much as you examine the methods available to Ruby objects with irb :

irb(main):001:0>

Time.instance_methods(false)


To find out about JavaScript objects in JavaScript Shell, use the built-in props function. For example:


props(document)

Methods: onclick
Methods of prototype: addBinding, addEventListener, adoptNode, 
appendChild, captureEvents, clear, cloneNode, close, 
compareDocumentPosition, createAttribute,
...

The props method lists all the properties and methods available to any object you pass to it. The blink(node) function flashes a red rectangle around an element on the page, letting you know its position: this can be useful for locating objects in a complex page. The load(scriptURL) function loads a script into the environment of the shell, making its objects and functions available to you.

Other features of working in the JavaScript shell are command-line completion and the ability to enter multiline blocks of code. To make a multiline block, use Shift+Enter at the end of each line.

See Also

  • The Venkman JavaScript Debugger, http://www.mozilla.org/projects/venkman


Rails Cookbook
Authors: Orsini R
Published year: 2007
Pages: 160-161/250
Buy this book on amazon.com >>

Similar books on Amazon