5.1 Diagnostics in ASP.NET
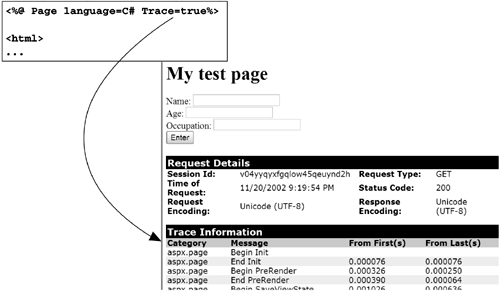
| ASP.NET offers several tools for diagnosing problems in your applications. Tracing provides a welcome alternative to printing diagnostic messages to your pages using Response.Write , which ASP developers have always relied on heavily. Application-level tracing is useful for tracking down problems that occur across multiple pages in an application. And more than 50 new performance monitor counters provide detailed diagnostic information about ASP.NET's behavior on your server. 5.1.1 Page TracingOne of the most useful, and easiest -to-use, diagnostic features of ASP.NET is page tracing. Simply adding Trace=true to your @Page directive causes ASP.NET to generate diagnostic information at the end of your normal page rendering, containing everything you would ever want to know about the request and its response. Page-level tracing is extremely convenient because just by placing one additional attribute on your .aspx page, you can quickly collect information about the any request made to that page. Figure 5-1 shows an example of a page that has enabled tracing and the resulting output generated when that page is rendered. Figure 5-1. Enabling Trace on a Page Enabling page tracing displays six pieces of information for a page, as listed in Table 5-1. The request details section shows the session ID, the time of the request, the encoding types of the request and response, and the resulting status code. The trace information section contains the output of trace statements made either by system libraries or by the page. The control tree section displays all the controls that were created to render the page along with how many rendering bytes they occupied and how much information they stored in the view state cache. The cookies collection shows the names and values of all cookies sent by a client. The headers collection shows all the header information presented by the client at the time of the request. Finally, the server variables section shows all the intrinsic server variables available to page scripts, and their values. Table 5-1. Contents of Page Trace Information
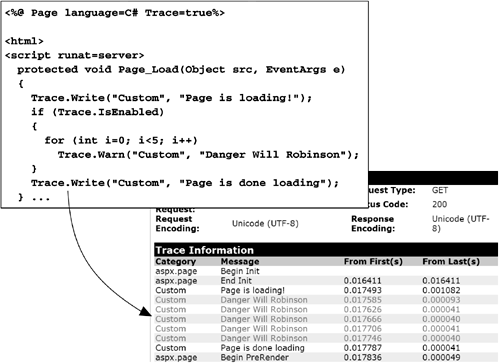
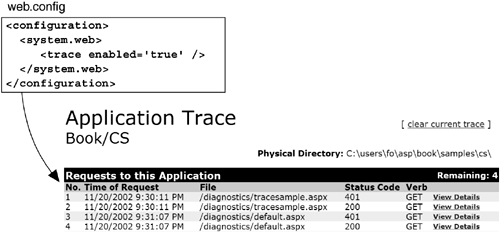
5.1.2 Writing Trace MessagesThe goal of enabling tracing on a page is to be able to see at a glance all the relevant data associated with a particular request, to easily diagnose any problems that might have occurred. Many of the methods in ASP.NET classes generate some output to the trace stream, as you will see if you enable tracing on a page. In addition to the ASP.NET-generated output, however, it is often even more useful to have custom output from your own classes and pages printed to the trace output stream. To do this, you can access the Trace property of your Page class that references an instance of the TraceContext class. You can use the Write method to send information to the trace information region of the trace output. If instead you use the Warn method, the trace statement is printed in red to indicate it is a warning. Finally, you can check to see whether tracing is enabled by querying the IsEnabled property of the TraceContext object if your trace operation involves any additional code that should be avoided when tracing is disabled, as shown in Figure 5-2. Figure 5-2. Writing Custom Trace Messages It is good practice to add trace output to most of your pages and classes, even if you see no immediate need for the information. When something goes wrong on a page, you are better off having more diagnostic information to help resolve the problem quickly. Tracing is appealing because it does not generate any output or occupy any additional computation time unless you explicitly enable it, so there is no cost in liberally adding trace messages to your pages. 5.1.3 Application-Level TracingIt is often useful, when you are trying to track down a problem, to be able to save several page traces for later review and analysis. You can do this by enabling tracing at the application level instead of the page level. When you enable tracing in your application-wide configuration file, ASP.NET saves the trace output of every page visited until you disable it. Figure 5-3 shows an example of enabling trace at the application level and the corresponding output generated by navigating to the trace.axd URL at any location in your application. Figure 5-3. Enabling Application-Level Tracing The attributes for the trace element are shown in Table 5-2. In addition to simply enabling, trace accepts requestLimit as an attribute to control how many pages to trace (which defaults to 10), pageOutput to control whether page-level tracing is shown as well, traceMode to control the sorting of the trace output, and localOnly to control whether remote access to the site can see the trace output. Once tracing has been enabled for an application, all requests made for pages in that application are traced and stored in-memory in the worker process. To view the page traces, navigate to trace.axd at the root of the application, for which a special HttpHandler is defined, and ASP.NET displays a list of all the traces stored since application-level tracing was enabled. Table 5-2. trace Element Attributes
5.1.4 Performance Monitor CountersIn addition to the page-level diagnostic features, ASP.NET provides many counters for the performance monitoring utility to track the performance and behavior of your applications. More than 50 counters are available, ranging from how many times the worker process has restarted to how many requests are processed per second. A partial list of the available counters is shown in Table 5-3. Table 5-3. Performance Counters Available for ASP.NET
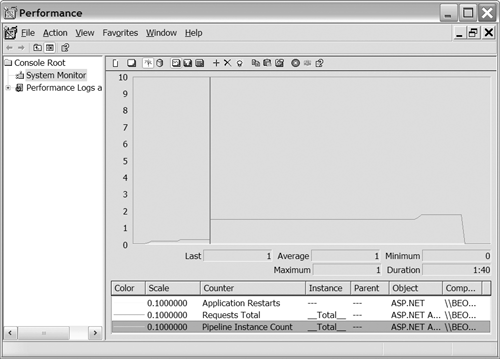
When you install ASP.NET, these counters should be installed on the same machine. To use any of the counters, bring up the Performance administrative tool ( perfmon.exe ), and choose to add a counter. You should see two categories of ASP.NET performance objects, one simply labeled ASP.NET and the other labeled ASP.NET Applications. Figure 5-4 shows a sample instance of the Performance tool with three of the ASP.NET performance counters activated. Figure 5-4. Performance Monitor |
EAN: 2147483647
Pages: 94
- Chapter IV How Consumers Think About Interactive Aspects of Web Advertising
- Chapter X Converting Browsers to Buyers: Key Considerations in Designing Business-to-Consumer Web Sites
- Chapter XIII Shopping Agent Web Sites: A Comparative Shopping Environment
- Chapter XVII Internet Markets and E-Loyalty
- Chapter XVIII Web Systems Design, Litigation, and Online Consumer Behavior


