12.2 Process for Value Rule Analysis
|
|
12.2 Process for Value Rule Analysis
The process is shown in Figure 12.1. It is a simple process of creating the tests, executing them, and reviewing results. You generally do not have these defined before you perform data profiling, because these are not normally considered part of the metadata for an application.
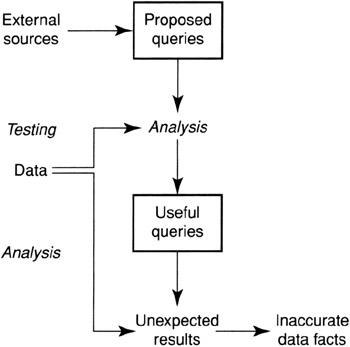
Figure 12.1: Value rule analysis process
Gathering Value Rules
You need to gather value rules from the user community. Those who understand the application and work with the data every day can provide valuable input. This includes business analysts and subject matter experts. The data profiling analyst may want to suggest some value tests that seem obvious from the nature of the data. Others will not be obvious.
These types of tests are just quick checks of the data to see if it conforms to some very broad indicators of completeness and correctness. It is not intended to be an extensive processing of the data, producing complex reports that require many hours to review. Accountants commonly produce such reports to check the reasonableness of data before doing their normal cycle of reports and audits. This is analogous to that.
You need to create an expectation of results before you execute them. This expectation should have been part of the reason for creating the test in the first place. Expectations should be documented. Often this is done as a range of possible outputs. For example, you may expect the percentage of BLUE gadgets in the INVENTORY database to be between 5 and 10%. You are setting the boundaries for judging whether the output is reasonable or not.
The generated tests and expectations need to be documented in the data profiling repository. If they prove to be useful for data profiling, they may be useful for periodic use in the operational setting.
Executing Value Rules
Because value rules often deal with aggregation values, it is important that all of the data be used. This means that attention must be paid to time period boundaries such as WEEK, MONTH, or QUARTER. Ensuring that all of the data for the period is included is necessary for some of the tests to have any meaning.
Using samples may produce alarming results even though the data may be accurate. The reason for this is that samples may include only some of the data within each discrete set. If sampling is used, complete sets of business objects need to be samples, not just randomly selected rows from the tables representing the business objects.
Evaluating Results
The results need to be verified in a group setting with the data profiling analyst and the business experts. You are looking for large deviations from normal. If the results are close to normal, they may be hiding some data inaccuracies. However, it is not worth the time to validate every value produced.
The results should be compared to the expectations. You should always have expectations in advance. If the result is outside the boundary of the expectation, you need to investigate the cause. It may be that the data is either incomplete or inaccurate, or it may be that the test was implemented inaccurately or possibly that the expectations were inaccurate.
After the first time through, you can tune the test and the expectations. Sometimes the expectations were set through a false understanding of the data. Investigation of deviations hopefully will educate the team on the nature of the data and allow them to set the expectations correctly.
Another useful activity is to compare the expectations to those produced in a prior execution of the test. Once you are comfortable with the test, you can repeat the test periodically and compare output sets. This may reveal trends within acceptable levels of values that may further extend your understanding of the data.
You may also decide to discard a test after seeing the results. It may be that the variability of the data is high enough to prevent setting expectations narrowly enough to be helpful. Either you are always investigating differences only to find no issues, or you are never investigating differences because the boundaries are set too far apart to catch anything. It is a perfectly valid response to discard a value test.
There may be data quality issues that result from this evaluation. Some of the issues will have very specific identification of inaccurate data, and others will have only the outward manifestation without being able to identify specific wrong values.
|
|
EAN: 2147483647
Pages: 133
- ERP System Acquisition: A Process Model and Results From an Austrian Survey
- The Second Wave ERP Market: An Australian Viewpoint
- Intrinsic and Contextual Data Quality: The Effect of Media and Personal Involvement
- A Hybrid Clustering Technique to Improve Patient Data Quality
- Development of Interactive Web Sites to Enhance Police/Community Relations