Load Testing with JMeter
The first thing you’re going to need for load testing, unless you have the aforementioned army of Web-savvy coolies, is some software to help you simulate a heavy load.
You have a number of options, including open-source software, commercial packages, and home-brewed efforts (which are universally a mistake). In this case, as the rest of the book focuses on open-source software, you need not look very far. Tomcat’s sister project, Apache JMeter, fits the bill quite nicely.
JMeter is capable of load testing FTP sites, JDBC data sources, and Java objects, but this chapter will focus on load testing HTTP servers and applications.
Installing and Running JMeter
JMeter’s home page is located at http://jakarta.apache.org/jmeter/. Download the distribution, and unpack it to a convenient location. Starting JMeter is as simple as entering the bin directory and running either jmeter.bat (on Windows) or the jmeter shell script (on Unix-style systems).
Making and Understanding Test Plans
Having started JMeter, you’ll see JMeter’s interface, as shown in Figure 14-1.
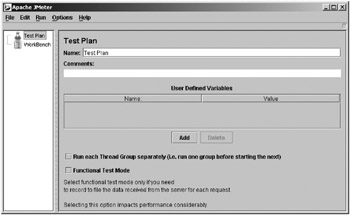
Figure 14-1: The JMeter interface
JMeter’s user interface consists of a tree in the left pane, representing the list of items and actions you can add, and a right pane that provides configuration forms and output windows for items from the left pane.
The test plan is at the heart of any JMeter session and is a list of actions you want JMeter to perform. You can add elements to the test plan by right-clicking its node and selecting Add from the pop-up menu.
The first element in a test plan is a thread group. Right-click the Test Plan node in the left pane, and select Add. You can now click its icon in the left pane to expose the thread group configuration pane, as shown in Figure 14-2. Leave the default configuration values to keep your first run simple.
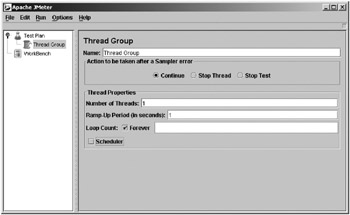
Figure 14-2: Thread group settings
Table 14-1 describes the available options.
| Option | Description |
|---|---|
| Name | If you had multiple thread groups, it’s useful to choose descriptive names that reflect their purposes. |
| Action to Be Taken After a Sampler Error | A sampler tells JMeter to send requests to a server. You can configure its behavior if there was any kind of error. |
| Number of Threads | The number of threads you’d like the thread group to spawn to carry out its work. If you wanted to simulate a heavy load, you’d want to increase this number to simulate simultaneous users. |
| Ramp-Up Period (in seconds) | JMeter will start with one thread and will add threads evenly over the course of the specified period until the number of threads configured has been reached. |
| Loop Count | The number of times you want JMeter to execute the elements of this thread group. The default is forever, which means the elements of the test plan will execute until you tell them to stop. |
| Scheduler | You can schedule the test to run at a more convenient time if resources are at a premium. |
Now that you have a thread group, you’re ready to start doing something with it. Right-click the Thread Group icon to view the Add menu. Select Simple Controller, and then add an HTTP request sampler, as shown in Figure 14-3.
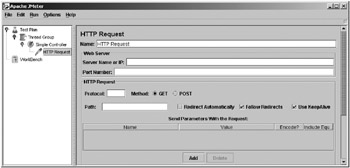
Figure 14-3: HTTP request group settings
Table 14-2 describes the configuration options available for an HTTP request sampler.
| Option | Description |
|---|---|
| Name | This is the same as in the thread group configuration. |
| Server Name or IP | A resolvable host name or IP address of the server you want to test. |
| Port Number | The port number of the HTTP server. The standard is 80 unless specifically configured differently. |
| Protocol | HTTP or HTTPS. |
| Method | Sets whether the test should send a GET or a POST request, which depends on what the page you’re requesting is expecting. |
| Path | The URI of the page you’re going to test. |
| Parameters | If you’re testing a dynamic application, the page may expect some parameters to be submitted along with the request. For example, if you’re testing the shopping cart functionality of an online store, you may send a model number for the product to add to your shopping cart. |
| Filename | Some Web applications accept file uploads via HTTP POST. This setting specifies which file you’d like to upload with the request. |
| Parameter Name | The file will be uploaded as a key-value pair. This is the name of the key that the Web application will use to reference the file in the request. |
| MIME Type | The type of the file you’re uploading. For example, an HTML file would have a MIME type of text/html, and an Adobe Acrobat file would be application/pdf. |
| Retrieve All Embedded Resources from HTML Files | If this is set, when a request is made for a Web page, the page will be parsed and all embedded images and applets will be downloaded as part of the request. If you were to test a graphics-intensive site for performance, this would more accurately reflect the end user experience, as the bulk of the response time would be apportioned to downloading images. |
| Use As Monitor | Select this to use this sampler as a monitor. A monitor uses Tomcat’s status servlet to request data on the server’s general health. You can use it to monitor the server and react to any issues. |
Keep this simple by filling in only the bare minimum number of fields for this first test. Assuming you have a Tomcat installation on the same machine from which you’re running JMeter, set the server name to localhost, port to 8080, and the path to /. If you were to run JMeter on a different physical machine from the server, you’d simply set the server name to the appropriate host or IP address of the server you wanted to load test. All other parameters can remain unchanged for now.
You have now done enough to start testing Tomcat’s performance. You can start the test by selecting Run ![]() Start from the menu bar. However, the example isn’t very practical so far, since you have no way to capture or view the results of the test.
Start from the menu bar. However, the example isn’t very practical so far, since you have no way to capture or view the results of the test.
JMeter separates the execution of a test plan from the collection and analysis of the test plan’s results. You can accomplish this with the Observer or, as it’s sometimes called, Event Listener design pattern. This is reflected in the JMeter interface by its use of the listener terminology. Controllers are responsible for performing actions, and listeners are responsible for reacting to those actions. Thus, if you want access to the results of a test plan, you must use one of the JMeter listeners.
To finish the simple test plan, right-click the Thread Group icon, and select Add ![]() Listener
Listener ![]() View Results Tree. Select the View Results Tree icon in the left pane to show its output window. You don’t need to add any configuration for this listener. When running a test with a view results tree listener, you can watch each response as it’s received from the server. Selecting the response from the bottom-left area of the right pane, you’ll see the actual data returned in the bottom-right area of that pane.
View Results Tree. Select the View Results Tree icon in the left pane to show its output window. You don’t need to add any configuration for this listener. When running a test with a view results tree listener, you can watch each response as it’s received from the server. Selecting the response from the bottom-left area of the right pane, you’ll see the actual data returned in the bottom-right area of that pane.
Before starting the test, you should save the test plan. Right-click the Test Plan icon in the left pane, and choose Save As from the pop-up menu. For consistency, use the default .jmx extension when saving your test plan.
Now, click the View Results Tree icon, and choose Start from the Run menu on the menu bar. You should see the Root node in the bottom-left pane change to a folder icon as test results start to come in. Click that node to open it, revealing the individual test results contained within. Selecting any of the results will change the bottom-right pane to show you the results of the request (including response code and load time) under the Sampler result tab, the actual request made under the Request tab, and the data received in the response under the Response data tab. Select Run ![]() Stop to finish the test.
Stop to finish the test.
Figure 14-4 shows the completed test plan with the view results tree listener activated.
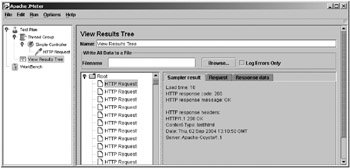
Figure 14-4: The results of the simple test
Examining JMeter’s Features
You now know how to load test a Web server and how to view the results of the test. You can get some idea of how well your Tomcat server is responding to the test in terms of load time and stability. If you were content to manually click through each result in the View Results Tree window and inspect the full page, this might be enough. Fortunately, JMeter provides many more features to aid you in capturing and analyzing load data. JMeter has five major feature types:
-
Configuration element
-
Listener
-
Logic controller
-
Sampler
-
Timer
Though JMeter can test many different types of server, I’ll cover only HTTP-related settings in the sections to follow.
Using Timer Features
In the previous example, JMeter spawns one thread and makes requests as fast as it and the server being tested can keep up. In real-world cases, it may not make sense to pound the server with a constant onslaught of requests. Only in exceptional cases will a server be faced with a large number of simultaneous requests with no delay in between.
To spare your server the full brunt of this load, and to make the load more representative of the real world, you can add a timer to your thread group. This will introduce some intelligent logic that regulates the frequency and speed of each thread’s requests. JMeter includes four types of timers—two random timers and two constant timers.
The constant throughput timer allows you to specify how many requests you want to make per minute, and the constant timer inserts a delay between each request for a given thread. These are just two different ways of saying the same thing, so take your pick as to which one you prefer.
The two random timers are the Gaussian random timer and uniform random timer. These timers simulate real-world traffic more accurately by inserting randomly calculated delays between the requests for each thread. The uniform random timer appends a random delay to a configurable constant delay, and the Gaussian random timer uses a statistical calculation to generate a pseudo-random delay. Each random timer takes a configurable constant time to which its random calculation will be appended.
To add a timer, right-click a thread group, select Timer from the Add menu, and choose the timer you want. Timers will affect the entire thread group to which they’re added but won’t affect peer thread groups. Adding more than one timer to a thread group will have a cumulative effect on the delay between requests.
Using Listener Features
JMeter uses listeners to monitor and react to the results of the requests it sends. The previous example used the view results tree listener to show the data returned from the server, the response time, the HTTP response code, and the HTTP response message. You add a listener by right-clicking a thread group and selecting the desired listener from the Add ![]() Listener menu.
Listener menu.
The listener listens only to the activity of the thread group to which it’s added. So, if you have two thread groups in your test plan, thread group A and thread group B, a listener added to thread group B will be oblivious to anything that happens in the scope of thread group A. Table 14-3 lists the listeners currently provided by default with JMeter.
| Listener | Description |
|---|---|
| Assertion Results | The output of the assertion elements of a sampler. |
| Graph Full Results | A cumulative graph of the response times of each request made. |
| Graph Results | A simple graph view, plotting individual data points, mean response time, and standard deviation of response time for all requests in its parent thread group. |
| Mailer Visualizer | Sends an e-mail to a specified e-mail address if a certain number of failures occur. You must add mail.jar to JMeter’s lib directory to add this listener. |
| Monitor Results | This listener shows you the results of any monitored samplers. |
| Simple Data Writer | Writes the results to a file in CSV format. |
| Spline Visualizer | A graph view of all data points made during a test plan run. Shows the results as an interpolated curve. |
| Aggregate Report | Each request sampler is given an entry in a table, and the totals and averages are calculated in real time. |
| View Results in Table | Provides a real-time view of the test results. |
| View Results Tree | Organizes the results into a tree. |
You can group each listener into one of three categories:
-
Visualization listeners
-
Data listeners
-
Other listeners
Visualization Listeners
Graph Full Results, Graph Results, and Spline Visualizer all create graphical, real-time depictions of the test results. Graph Results is the simplest and most popular of these, plotting mean response time, standard deviation, and individual data points.
Data Listeners
Simple Data Writer, View Results in Table, Aggregate Report, and View Results Tree capture the raw data, response time, and return codes returned from the server. While View Results in Table and View Results Tree are useful as status checkers while running tests, Simple Data Writer is perhaps the most important of the listeners. Simple Data Writer listeners perform the simple task of logging response time to a file, as well as logging response codes and other information. This is an important tool, because it allows you to keep your data for posterity as well as to import the data into other more sophisticated tools for more detailed analysis.
| Note | All the listeners, except the Monitor Results listener, can use the Simple Data Writer listener as well. When you configure one of these elements, add the filename of the results file as you would for a Simple Data Writer listener. |
You can save the data as an XML file or as a CSV file. The following setting is in the jmeter.properties file:
jmeter.save.saveservice.output_format=xml
The Simple Data Writer listener offers the following configuration options:
-
Name: A descriptive name for the simple data writer element as it will appear in the test plan.
-
Filename: The path to the output file to be created by the file reporter. If you supply a relative path, it’s relative to JMETER_HOME/bin.
The Monitor Results Listener
If you want to monitor the server’s overall performance, you can use the Monitor Results listener. This listener allows you to monitor multiple Tomcat servers from one console, using the manager application’s status servlet.
It’s a good idea to create a new thread group for a Monitor Results listener. Name it Server Status Thread Group, and add an HTTP request sampler. Set the host name, port, and protocol as normal. Now set the path to /manager/status, and add a request parameter called XML and set it to true. Finally, check the Use As Monitor box. The XML parameter will cause the status servlet to return its response in an XML format that JMeter can translate into monitoring information. Figure 14-5 shows this setup.
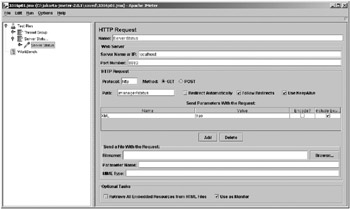
Figure 14-5: The HTTP request sampler for the Monitor Results listener
The manager application is protected by authentication, so you’ll have to send your authentication information along with your request. To do this, add an HTTP authorization manager configuration element to the HTTP request sampler using the Add menu. Set the Base URL to http://servername:port/manager, and the Username and Password properties to a user with the manager role.
Finally, add a monitor results listener and a constant timer, set to 5,000 milliseconds. After all, you don’t want to drown your server with the monitoring tool.
When you run the test, check the Monitor Results listener to see how your server is performing. The Health tab will show a summary of the server’s performance, with a colored icon indicating general health and a load bar that tells you the relative load. The Performance tab breaks down the server’s performance.
The Assertion Results Listener
You use assertions to test if the response contains the data that you expect. If you want to see the results of your assertions, add an Assertion Results listener to your thread group. It will show you the URL of the request and the result of the assertion as applied to the response.
The Mailer Visualizer Listener
If you want to be informed of any successes or failures in your test plan, then you should configure a Mailer Visualizer listener. Fill in your details as shown in Figure 14-6.
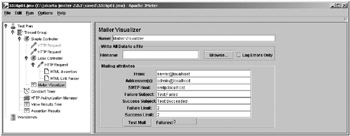
Figure 14-6: A Mailer Visualizer listener
Using a Logic Controller Feature
A logic controller’s primary purpose is to manage the execution flow of a test plan. They’re containers for other executable test plan elements. Logic controllers that are added to a thread group—or even as a subnode of another logic controller—will be treated by their parent execution context as a single node to be executed. Elements added beneath logic controller nodes will be executed according to the rules of the specific logic controller to which they’re added.
Like thread groups, logic controllers create a separate namespace for listeners, timers, and other elements, which are context specific. You can think of logic controllers as the closest approximation JMeter test plans have for the while, for, and function constructs of typical programming languages.
The Interleave Controller
The Interleave controller will execute one of its subelements each time its parent container loops. It will execute them in the order in which they’re listed in the configuration tree. For example, if you were to create an Interleave controller with four elements under a thread group set to loop 14 times, JMeter would execute the entire set of Interleave controller subelements three times and would then execute only the first two subelements a fourth time (4 + 4 + 4 + 2 = 14).
Interleave controllers are good for testing a sequential process, where each request depends on the previous request for successful completion. An obvious example is an online shopping application, where a user searches for an item, adds it to their shopping cart, enters credit card details, and finalizes the order.
The Simple Controller
The Simple controller is a container for other elements and provides no special functionality. You can use the Simple controller to organize test elements in much the same way as you use folders on a file system to organize their contents.
If you were to load test a site with a nontrivial amount of functionality, it would make sense to use Simple controller elements to separate the tested functionality into related modules to ensure a maintainable test plan. This enhances the maintainability of the test plan in the same way that dividing large software projects into modules and functions enhances the maintainability of the software.
The Loop Controller
The Loop controller will loop through all its subelements as many times as specified in the Loop controller’s configuration panel. Therefore, any elements under the Loop controller will execute this number of times, multiplied by the number of times the parent thread is set to loop. If you were to configure a Loop controller to loop four times under a thread group that loops four times, each subelement of the Loop controller will be executed 16 times.
The Once Only Controller
The Once Only controller executes its child elements only once during the run of a load test. You can use this controller to execute an initial login, create an application entity on which other tests depend (for example, creating an order in a sales application so you can manipulate it with other requests), or perform any other operation that needs to happen only once.
Using Assertions
Even if your application is giving subsecond responses, you have no cause to celebrate if its output is invalid. An assertion gives you a way to validate the actual data returned as a result of each request so that you can be sure the server is both responsive and reliable. Assertions are created as subelements of samplers, such as the HTTP request sampler. An assertion is a declaration of some truth you want to test against.
You could declare, for example, that the resulting output should contain the word Hello. When this assertion exists, the response of the HTTP request to which it is added will be checked for the existence of Hello and will throw an assertion failure if the string isn’t present.
Given the simple HTML file in Listing 14-1, you’ll build an assertion that validates its output during load testing. Call it hello.html and place it in the tomcatBook Web application’s ch14 folder.
Listing 14-1: A Sample HTML Page for Testing Assertions
<html> <body> Hello, World! </body> </html>
The first step is to build an HTTP request sampler into the test plan that will access the file’s URL. After creating the HTTP request sampler, you can now right-click the HTTP Request icon, and then choose Assertions ![]() Response Assertion from the Add menu. Select the new assertion, and add a new pattern, as shown in Figure 14-7.
Response Assertion from the Add menu. Select the new assertion, and add a new pattern, as shown in Figure 14-7.
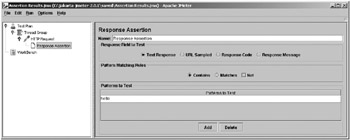
Figure 14-7: A response assertion
JMeter assertions accept Perl-style regular expressions, so the assertion you’ve added will match occurrences of the string Hello. Hello, World is a matching occurrence of this regular expression, so the assertion should pass.
In this example, the Contains option tests that the page contains the pattern you’ve added. If you wanted to check the entire Web page, you could use the Matches option, which would check that the page returned directly matches the pattern you add.
Add an assertion results listener to the thread group, and run the test. You should see the results, as in Figure 14-8.
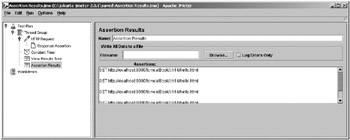
Figure 14-8: Viewing successful assertions
The results of the assertion don’t show any assertion failures, so the tests were successful. If they were to fail, you would see something similar to Figure 14-9.
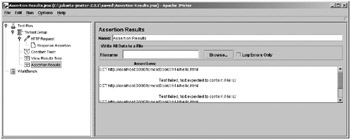
Figure 14-9: Viewing unsuccessful assertions
You can test many different aspects of a response, including its response code and the contents of the entire response. If you want to validate your HTML, add an HTML assertion and select the strictness of the test. Assertions also exist for testing the server response time and the size of the response.
Using a Configuration Element
A configuration element’s job is to modify requests in some way. They offer a pluggable way to add request modification logic from various types of default values to automatic building of requests.
The HTTP Header Manager
In some cases, application testing will require specific HTTP headers to be set to get a valid reflection of true application performance. For example, if an application performs different actions depending on the browser type making the request, it’s necessary to set the User-Agent header when making test requests.
You use the HTTP header manager to explicitly set header keys and values to be sent as part of each request. If added as a node under an HTTP request element, the custom headers will be sent only for the request under which they’re added. These headers will be sent with every request in the same branch if they’re set at the thread group level.
Configuring an HTTP header manager is simple and is similar to configuring the name/value parameters in an HTTP request element.
The HTTP Authorization Manager
The HTTP authorization manager handles requests that require HTTP authentication. Like the HTTP header managers, they can be added directly underneath an HTTP request element or to an entire branch of a tree. Their configuration parameters are simple, accepting a base URL from which it will attempt to send authentication credentials, plus the obligatory username and password. You saw this element in action in “The Monitor Results Listener.”
The HTTP Cookie Manager
Like HTTP authorization managers and HTTP header managers, HTTP cookie managers can accept a hard-coded list of cookies that should be sent for every request. In this way, you can simulate a browser that has previously visited a site. Additionally, HTTP cookie managers can mimic a browser’s ability to receive, store, and resend cookies. So, for example, if a cookie is dynamically assigned to each visitor, the HTTP cookie manager will receive it and resend it with every appropriate subsequent request.
You can also add HTTP cookie managers to a thread group or directly to an HTTP request element, depending on the scope of its intended influence.
The HTTP Request Defaults
In most cases, each test plan will be created for a single-server environment or online application. Because of this, you’ll find yourself typing the same server name, port, path, or parameters into each new HTTP request sampler you add to the test plan. HTTP request defaults eliminate this duplication of work by allowing you to specify defaults for many of the HTTP request element’s configuration parameters. After adding the defaults, you can leave these fields blank in any HTTP request element in the same thread group.
For example, if you were load testing an application that follows the Model View Controller design pattern, with all traffic flowing through a single HTTP servlet, you may have a common base URL for every request like this: http://loadtest.apress.com/Router/.
This servlet will provide access to different functionality in the application via a request parameter such as the following:
http://localhost:8080/Router?action=addToCart http://localhost:8080/Router?action=checkOut
The server name, port, protocol, and path are common to all HTTP requests that access this application, with only the request parameters varying. In such a case, you could add an HTTP request defaults element, as shown in Figure 14-10.
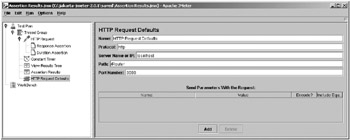
Figure 14-10: Setting default values for HTTP tests
Any requests that are in the same thread group will inherit these settings unless they’re explicitly overridden in their own configurations. To access any addToCart and checkOut features of your imaginary application, you’d need to add HTTP request elements, leaving all configuration options blank except for the addition of the action parameter and corresponding values. In a large load test scenario with potentially tens of HTTP requests, this will really save you time and give your fingers a break from typing.
Using Preprocessor Elements
You use the preprocessor elements to modify a sampler’s request before it’s sent to the server and they can extract links from a Web page or options from a form. Once JMeter has this information it can use it to iteratively follow each link or submit each option. Other functionality includes adding a counter before each request and adding user variables before each request to test different behavior depending on the variable sent to the server.
Creating a Web Spider
If you want to run through your application to check that all your links work and are valid, you can use JMeter as a Web spider. To do this, create a simple controller and an HTTP request sampler. In this example you’ll use the JSP examples Web application, so set the path to /jsp-examples/. Add a constant timer if you don’t want to burden your server too much.
Now that you have the initial request set up, you can then use its results to modify subsequent requests. However, if you put settings (in the form of regular expressions) into the original request to be modified by subsequent requests, then the original request won’t return meaningful results because Tomcat won’t recognize them. If the original request doesn’t return meaningful results, then the subsequent requests can’t be modified. To solve this, you must use another HTTP request sampler to work on the new requests.
Add another HTTP request sampler with the path set to .*. This matches any links found in the response returned by the previous requests and fills in the values for this request. For this to work, though, you must add an HTML link parser to this HTTP request sampler. You don’t have to configure any extra settings on this component. If you want to see the results of the link parser, you should add a listener. If you’re testing for valid links, you could add an assertion, as shown in Figure 14-11.
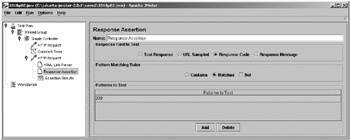
Figure 14-11: A response assertion to test that a resource exists
To see if all the links on your site link to existing resources, add an assertion listener and run the test. You’ll see each link from the jsp-examples Web application executed in turn and will be told if any don’t exist. Rename one of the files to see what happens.
Using Post-Processor Elements
Post-processor elements act after a request has finished. You can use them to save the responses to a file for your reference, stop the test if an error occurred, or create a running summary. To use this functionality, add a post-processor to a sampler.
Generating Summaries
To generate a running summary of a test, add a Generate Summary Results post-processor element to an HTTP request sampler. You can view the summary in stdout, in JMeter’s log file, or in both. You can configure where the summary is sent, and how often it is compiled, in jmeter.properties. The following sends the summary to the JMeter log file but not to stdout:
summariser.interval=300 summariser.out=false summariser.log=true
The summariser.interval setting is the number of seconds between summaries. The default is 180 (that is, three minutes). The other two settings aren’t mutually exclusive, and you can set them both to true if you want. Here’s an example of the summary:
2004/10/25 23:31:03 INFO - jmeter.reporters.Summariser: Generate Summary Results = 22 in 86s = 0.3/s Avg: 3 Min: 0 Max: 20 Err: 0 (0.0%)
Here, 22 responses were returned in 86 seconds, which is 0.3 responses per second. The average response time was 3 milliseconds, with response times ranging from 0 to 20 milliseconds.
EAN: 2147483647
Pages: 94