The Troubleshooter s Toolbox
|
The Troubleshooter's ToolboxIn this section, we present some of our favorite tools and techniques for troubleshooting security-related and network problems. The tools in this section are organized by the TCP/IP layers to which they apply; that way, you can pick and choose between them depending on the kind of problem you are addressing. You will see that some of the tools apply to multiple layers, which represents the nature of most troubleshooting efforts. You will also learn how the tools can help you zero in on a particular layer, depending on the problem symptoms.
Application Layer TroubleshootingFirst, let's look at some tools that can assist with troubleshooting problems at the application layer. This layer primarily addresses issues that arise on the local machine, such as configuration file locations and missing link libraries. Another area that can be problematic is the Domain Name System (DNS). Applications query DNS to resolve hostnames to IP addresses; therefore, if the DNS server isn't responding for some reason, applications that use hostnames as opposed to IP addresses cannot function. Often the client software used for the applications can be useful in debugging problems. Most email clients, for example, include menu items to view all the message headers, which can be invaluable in determining where an email came from, to whom it was addressed, and so on. You might use a client combined with other tools to dig into the actual network traffic that is associated with the application. A couple tool classes that are especially worth mentioning are DNS query tools and system call trace utilities. Nslookup is a common DNS query tool, whereas common trace utilities include strace, ktrace, and truss. A couple other useful tools in this category are strings and ldd. NslookupMany application communication problems are associated with DNS. Applications query DNS through the resolver, which normally occurs transparently to the end user of the application. DNS is always a good place to start troubleshooting when your application can't connect to a remote host by its name. First, make sure that IP address connectivity is successful and then verify that the hostname you are attempting to contact maps to the IP address it is supposed to. You can do this by using a tool to query the DNS. Perhaps the most common DNS query tool is nslookup, which is available on both UNIX and Windows NT and higher. It can be most helpful in diagnosing application layer connectivity problems involving your secure network architecture. Note Although we focus on the cross-platform tool nslookup in this section, UNIX platforms offer another tooldig. Dig provides more information with fewer keystrokes after you get used to its syntax, and it's a fine substitute for nslookup if it's available. UNIX-based operating systems provide a Network Name Switch (NSS), whereby the functions used to query the resolver can first check a local file before issuing a DNS query. The search order is configurable on most UNIX variants through the use of the /etc/nsswitch.conf file, and the local file is in /etc/hosts by default. You must consider this when you're doing DNS troubleshooting. Windows does not have a configurable NSS capability. The local file is always searched before DNS. The local file is located in %SystemRoot%\hosts on Windows 9x and in %SystemRoot%\system32\drivers\etc\hosts on Windows NT and higher. For new installs, you will find a hosts.sam (sample) file at that location, which you will have to rename or copy to hosts (without the extension). Don't edit the hosts.sam file and expect it to work! For example, suppose you're trying to use SSH to access an external server by name, and the command simply hangs without establishing a connection. This could indicate a problem with DNS or with your NSS configuration. You can use nslookup to bypass the NSS and query DNS directly, as follows: $ ssh www.extdom.org never connects, no error messages, nothing ^C $ nslookup www.extdom.org Server: 192.168.1.2 Address: 192.168.1.2 Non-authoritative answer: Name: www.extdom.org Address: 192.168.2.100 The nslookup query puts www.extdom.org at 192.168.2.100, which in this case is correct. If you're working from a UNIX host, check /etc/nsswitch.conf, as follows, to determine which name resolution facility the host uses: $ grep hosts /etc/nsswitch.conf hosts: files nisplus nis dns The hosts line indicates that local files are checked before other name services, including DNS. This means that if an entry exists in /etc/hosts for www.extdom.org, it will be used in preference to DNS. Check /etc/hosts, as follows: $ grep www.extdom.org /etc/hosts 192.168.2.111 www.extdom.org Because the entry doesn't match the DNS information we obtained earlier, we clearly have the wrong address in the /etc/hosts file. The administrator might have switched the web server to a different host, justifiably thinking that he could notify the world of the change through DNS. Although you could modify /etc/nsswitch.conf to change the NSS search order, it's often handy to override name resolution through local files. The best fix for this problem is probably to delete the entry in /etc/hosts. Tip A quick way to determine which address an application is using, without examining the /etc/nsswitch.conf and /etc/hosts files, is to ping the target host. Ping does not query DNS directly like nslookup does, so it goes through the NSS to get the destination IP address and then prints this to the screen, even if a firewall blocks its packets. If you're executing it on Solaris, you will have to specify the -n switch to see the IP address. Also, remember that NSS operates differently on Windows, where it checks the local file and DNS and then tries to resolve the NetBIOS name. System Call Trace UtilitiesSystem call trace utilities monitor the OS calls that an application executes and print the details to the console or a specified output file. This can be a great way to find out where an application looks for its configuration files. Suppose that you install the binary OpenSSH distribution for Solaris from http://www.sunfreeware.com and can't find in the documentation where it hides its sshd_config file. Just run truss on the sshd executable: # truss -o sshd.truss sshd # grep conf sshd.truss open("/usr/local/etc/sshd_config", O_RDONLY) = 3 open("/etc/netconfig", O_RDONLY) = 3 open("/etc/nsswitch.conf", O_RDONLY) = 3 Here, we saved the truss output (which is usually voluminous) to sshd.truss and then searched for anything that looks like a configuration name. This example shows sshd trying to open the file at /usr/local/etc/sshd_config. If you browse the truss output, you will see a wealth of other information about the application. Tip SGI IRIX includes the par utility, which produces system call activity. For similar functionality, HPUX admins can download the tusc program at ftp://ftp.cup.hp.com/dist/networking/tools/. For non-Solaris operating systems, you can get the same type of information from the strace and ktrace tools. Strace is usually distributed with Linux, and ktrace with BSD. Tip Look for an open source version of strace for Windows NT and higher at http://www.bindview.com/support/Razor/Utilities/. Take note of its shortcomings, however. To install strace, copy the strace.exe and strace.sys files from the zip archive to %SystemRoot%. Other Useful UtilitiesOther useful utilities for debugging problems at the application layer include the strings and ldd utilities for UNIX. Strings outputs everything from a binary file that looks like a printable string, which enables you to browse or search for interesting stuff. For example, the following command executed on a Linux machine shows the Sendmail version to be 8.11.0. (We use the sed utility to filter out lines before the version.c string and after the next line beginning with @.) tricks like this one can let you quickly gain access to information that you might have otherwise had to spend a considerably longer time researching. # strings /usr/sbin/sendmail | sed -e '/version.c/,/^@/!d' @(#)$Id: version.c,v 8.43.4.11 2000/07/19 20:40:59 gshapiro Exp $ 8.11.0 @(#)$Id: debug.c,v 8.2 1999/07/26 04:04:09 gshapiro Exp $ Note BinText is a Windows-based tool that does pretty much the same thing as the UNIX strings utility. It's free and can be downloaded from http://www.foundstone.com. The ldd command prints shared library dependencies, which can come in handy when you're installing or copying executables. The following output shows all library dependencies are met for the TCP Wrappers daemon on an IRIX 6.5 machine: $ ldd /usr/freeware/bin/tcpd libwrap.so.7 => /usr/freeware/lib32/libwrap.so.7 libc.so.1 => /usr/lib32/libc.so.1 Troubleshooting Check Point FireWall-1 with FW MonitorLike many firewalls, Check Point FireWall-1 only logs the initiating packet of any given network transaction. Because of this, there may be times when you want to see what FireWall-1 is doing with packets other then those that initiate a connection, or when you need to track down packets that are not showing up in the logs for some other reason. FireWall-1 has an integrated function to show all packets as they enter and leave any of its interfaces called FW Monitor. FW Monitor is run from the FireWall-1 enforcement point's command prompt. Simply type in fw monitor, followed by e expression, where expression represents a capture filter that will cause only the specific traffic you are interested in seeing to be logged. It is advisable to use a capture filter on heavily used production firewalls to prevent the monitor process from overwhelming the firewall. Output of this command is very similar to Tcpdump, but with each line preceded by the interface the packet came in on and then a single lettereither i, I, o, or O. The i means that the packet is inbound before being processed by the FireWall-1 kernel, whereas I means the packet is inbound after passing through the FireWall-1 kernel. The o means the packet is outbound before the FireWall-1 kernel, and O means it is outbound after leaving the FireWall-1 kernel.1 These additional pieces of information can be invaluable when troubleshooting dropped packets on your FireWall-1. For more information on FW Monitor, and specifics on how to build its capture filters, check out the article "How to use fw monitor," available at http://www.checkpoint.com/techsupport/downloads/html/ethereal/fw_monitor_rev1_01.pdf.
Transport Layer TroubleshootingThe transport layer encompasses many of the problems with which you're likely to deal. The transport layer directly addresses connectivity issues associated with network services. In this section, we will describe the following tools:
Our goal is to show you how to effectively use these tools to troubleshoot problems at the transport layer. As a result, most of the tools in this category test transport layer connectivity. A few of the tools display connection information for the host on which they are run. We have selected these tools because their value will likely lead you to use them over and over again. TelnetTelnet and its underlying protocol were developed so that local users could start a shell session on a remote host. Telnet uses TCP port 23 by default, but it's incredibly handy simply because it takes an optional command-line argument to specify the remote TCP port you want to connect to. In addition, the Telnet client is available on almost every platform, including many routers, making it an excellent troubleshooting tool to test TCP connectivity and service availability. Note Telnet is a TCP application and can only be used to test TCP connectivity and availability on hosts. If you need to troubleshoot services running on UDP, you will need to rely on another tool, such as Netcat or hping (covered later in this section). The behavior of Telnet clients typically varies by OS. Whereas most Telnet versions that come with UNIX-type operating systems print an escape character message after the connection is established, followed by any header information that the server cares to return, Windows Telnet versions display a blank screen followed by the application-returned header information. Though the escape character (Ctrl+]) is not displayed after connection with the Windows version of client, it still works to terminate communications sessions. In either case, this provides a quick way to check whether the remote service is accessible. For example, suppose you're having trouble connecting with SSH to a remote server. To test whether the service is available, you can Telnet to port 22 on the server: # telnet mail-dmz.zilchco.com 22 Trying 192.168.1.20... Connected to mail-dmz.zilchco.com (192.168.1.20). Escape character is '^]'. SSH-2.0-OpenSSH_2.9 ^] telnet> quit After the Escape character is '^]' message appears, you know that the connection is established, which is useful for services that don't return greetings. Note All examples of Telnet in this chapter will use a UNIX version that displays an escape character message after a connection is established. It is important that you understand the differences in expected output when troubleshooting with various distributions of Telnet clients. In this case, a banner announces some details about the secure shell server. To break the connection, type ^] (Ctrl+]) to get a telnet> prompt, from which you can end the session gracefully by typing quit. Now let's see how Telnet behaves when the remote service isn't available: $ telnet mail-dmz.zilchco.com 21 Trying 192.168.1.20... telnet: Unable to connect to remote host: Connection refused FTP (port 21) is obviously not running on the server. Now for one more example; we have been going into all this detail for the grand finale, for which we pose the following puzzle: # telnet mail-dmz.zilchco.com 143 Trying 192.168.1.20... Connected to mail-dmz.zilchco.com (192.168.1.20). Escape character is '^]'. Connection closed by foreign host. What is the meaning of this output? We established a connection to the IMAP service on port 143, but we never got a greeting before the connection terminated. This is almost always indicative of a service that is protected by TCP Wrappers. The tcpd daemon accepts the connection and then validates the client IP address against the /etc/hosts.allow and /etc/hosts.deny files to determine whether it's allowed to connect. If it's not, the tcpd daemon terminates the TCP session. As you have seen in this section, Telnet makes an excellent troubleshooting tool. Realize that this functionality can be applied in two different ways:
It is important to realize that both components need to be tested for a solid troubleshooting methodology when testing connectivity across a firewall. For example, if you wanted to see if SQL was running on a host on the other side of a firewall from the host you were testing from, not only would connectivity need to be opened on the firewall, but SQL would need to be running on the remote host. Both of these points should be considered when troubleshooting a network connection. If a developer contacted you and complained that one of his web servers could not connect to its SQL back-end server across the firewall, your Telnet troubleshooting should be two-fold. First, you could attempt to access the SQL port (TCP 1433) of the back-end SQL server from a host that resides on the same segment. If this test doesn't work, you could conclude (because there are no access control devices between the two hosts) that the problem is on the back-end SQL server itself and your troubleshooting should continue there. If the Telnet test works, this proves that SQL is running properly and is available on the server. You could then attempt the same access from the web server experiencing the issue on the other side of the firewall. If the connectivity fails, you could infer that the traffic is being prevented in some way by the firewall. Taking advantage of both these techniques is an invaluable aid when troubleshooting Layer 3 connectivity.
NetcatWe doubt you will ever see a TCP/IP network troubleshooting discussion that doesn't include Netcat. The Netcat program, usually named nc, has several capabilities, but its core feature is probably the most usefulthe ability to open a socket and then redirect standard input and standard output though it. Standard input is sent through the socket to the remote service. Anything that the socket receives is redirected to standard output. This simple capability is unbelievably useful, as we will show you in a moment. For now, you can become familiar with Netcat's other options by executing the command nc -h. You will see a source port option (-p), a listener option (-l), and a UDP option (-u). You might also try connecting to a TCP service by executing nc -v remotehostip port. This allows Netcat to be used for service availability and connectivity testing, as was shown with Telnet earlier in this section. Note that you break a Netcat connection with Ctrl+C rather than Ctrl+]. Also, take notice of Netcat's support for UDP, making it a more complete troubleshooting solution. However, Netcat does not come with every operating system distribution like Telnet does. Also, Netcat employs additional capabilities that we will go over later in this section. Note Although Netcat started out as a UNIX tool, it has been ported to Windows. Netcat is included with most Linux and BSD distributions, but it might not be installed by default. You can download Netcat from http://www.securityfocus.com/tools/139. Let's consider a situation in which an administrator is unable to query an external DNS server while troubleshooting another problem. You decide to investigate. You know that the organization uses a router to restrict Internet traffic, and you hypothesize that it has been configured to accept only DNS queries that originate from port 53. How do you find out? You choose a test case based on Netcat. Note DNS servers are sometimes configured to forward queries from source port 53, so router filters can be constructed to allow query responses without opening inbound UDP to all nonprivileged ports. Instead, only traffic destined for the DNS server IP address on UDP port 53 from the source port UDP 53 would be allowed. Otherwise, you would need to allow all UDP traffic with a port greater than 1023 to your DNS server. Of course, this wouldn't be necessary if the router supported reflexive ACLs, as described in Chapter 2, "Packet Filtering." Most DNS queries are encapsulated in UDP datagrams. UDP, being a stateless transport protocol, does little validation of received datagrams and simply passes them on to the application. This means that the application must decide whether to respond to datagrams that don't make sense. DNS silently drops most such datagrams. We have to send a valid DNS query to receive a response and prove that source port 53 filtering is in place. Nslookup can't use source port 53, so we have to find another way. First, capture a query using Netcat and save it in a file: Note If you're running UNIX, as in the following example, you have to be logged in as root to bind port 53. () # nc -u -l -p 53 >dnsq & # nslookup -timeout=5 www.yahoo.com localhost ^C # kill %1 The background Netcat command listens on UDP port 53 (we assume this isn't a DNS server, which would already have port 53 bound) and redirects anything that is received to a file named dnsq. Then, Nslookup directs a query to localhost, so it's intercepted by Netcat and written to the file named dnsq. Press Ctrl+C before the specified 5-second timeout to terminate Nslookup before it issues a second query. Then kill the background Netcat, which causes it to print the punt! message. If you have a hex editor, the contents of file dnsq should look something like this: 00000000 00 43 01 00 00 01 00 00 00 00 00 00 03 77 77 77 .C...........www 00000010 05 79 61 68 6F 6F 03 63 6F 6D 00 00 01 00 01 .yahoo.com..... Finally, execute Netcat again to send the captured query using source port 53 to the remote DNS server and save any response to another file: #nc -u -p 53 -w 10 dns_server 53 <dnsq >dnsr The -w option specifies a timeout of 10 seconds; therefore, you don't have to terminate Netcat manually. If a response is received, the dnsr file will have a nonzero size and you will know that your hypothesis is correct: The router allows outbound DNS queries if the source port is 53. NetstatIf you aren't already familiar with it, you will find the netstat utility invaluable in debugging several types of connectivity problems. It is distributed with all UNIX and Windows variants, but unfortunately its command-line options vary greatly. For additional information on netstat and its switches on your platform, look at the UNIX man page or netstat /? from the command line in Windows. Use netstat to display information about transport layer services that are running on your machine and about active TCP sessions. This way, we can corroborate or disprove the information we gathered with Telnet regarding connectivity or service availability. We will also demonstrate other uses for netstat in subsequent sections. To display active connections and listening ports, use the -a switch and the -n switch to prevent hostname resolution and display IP addresses. With UNIX, you might also want to use the -f inet switch to restrict the display to TCP/IP sockets. As an example, here's the output from a hardened OpenBSD web server: $ netstat -anf inet Active Internet connections (including servers) Proto Recv-Q Send-Q Local Address Foreign Address (state) tcp 0 0 192.168.111.99.22 192.168.111.88.33104 ESTABLISHED tcp 0 0 192.168.111.99.22 *.* LISTEN tcp 0 0 192.168.111.99.80 *.* LISTEN tcp 0 0 192.168.111.99.443 *.* LISTEN We see the TCP and UDP port numbers displayed as the final "dot field" (for example, .22) in the Local Address column. Only three TCP services are running on the machine, as identified by the LISTEN state: SSH on TCP port 22, HTTP on TCP port 80, and HTTPS on TCP port 443. The SSH session has been established from 192.168.111.88. The output from the command netstat a n looks a little different on a Windows XP system: Active Connections Proto Local Address Foreign Address State TCP 0.0.0.0:135 0.0.0.0:0 LISTENING TCP 0.0.0.0:445 0.0.0.0:0 LISTENING TCP 10.0.0.24:139 0.0.0.0:0 LISTENING TCP 10.0.0.24:2670 10.0.0.3:139 ESTABLISHED TCP 127.0.0.1:1025 0.0.0.0:0 LISTENING TCP 127.0.0.1:1027 0.0.0.0:0 LISTENING TCP 127.0.0.1:1032 0.0.0.0:0 LISTENING UDP 0.0.0.0:445 *:* UDP 0.0.0.0:500 *:* UDP 0.0.0.0:1026 *:* UDP 0.0.0.0:1204 *:* UDP 0.0.0.0:4500 *:* UDP 10.0.0.24:123 *:* UDP 10.0.0.24:137 *:* UDP 10.0.0.24:138 *:* UDP 10.0.0.24:1900 *:* UDP 127.0.0.1:123 *:* UDP 127.0.0.1:1900 *:* UDP 127.0.0.1:1966 *:* Here the ports are listed after the colon following the local addresses. Otherwise, the display is pretty similar. The Linux netstat command-line options are significantly different from those of most other UNIX variants. For example, you use --inet instead of -f inet. Windows doesn't include an inet option because that's the only address family its netstat can display. As you can see, netstat is a powerful troubleshooting tool. It can be used in conjunction with a tool such as Telnet to confirm or disprove troubleshooting hypotheses. For example, let's say that, as in the last section, you attempt a Telnet connection across a firewall from a web server in the DMZ to a SQL server on your inside network and it fails. This would insinuate either that the service is not running on the server or that the firewall is blocking the connection. After logging in to the SQL server and running the netstat a -n command, you receive the following output: Proto Local Address Foreign Address State TCP 0.0.0.0:1433 0.0.0.0:0 LISTENING This shows that the server is listening on TCP port 1433 (Microsoft SQL Server protocol) and is waiting for a connection. More then likely, the traffic is being blocked on its way in by the firewall. Firewall logs could be used to corroborate that hypothesis. However, what if you had received the following netstat a n output instead? Proto Local Address Foreign Address State TCP 0.0.0.0:1433 0.0.0.0:0 LISTENING TCP 10.0.0.1:1433 172.16.1.3:1490 ESTABLISHED This tells us that not only are we running the SQL service, but we are receiving SQL connection traffic from the host at address 172.16.1.3. If this was the "troubled" web host that could not connect, either some access control mechanism is blocking the return traffic or there is a routing issue from the SQL server to the web host that we need to investigate. If the listed host is another host that could connect successfully to the SQL server, the firewall may still be blocking traffic from our "troubled" web host. Learning how to combine the information gathered from multiple sources such as these is vital in the development of strong troubleshooting skills. LsofThe UNIX lsof utility can display everything covered by netstat, and much more. Unfortunately, lsof isn't part of most distributions. If you can't find a trusted lsof binary distribution for your platform, you can get the source at ftp://vic.cc.purdue.edu/pub/tools/UNIX/lsof/. Lsof is included in our toolbox primarily because of its capability to list the process ID (PID) and command name associated with a socket. This is useful if you're investigating a possible break-in on your machine or verifying that a service is running on it. (The Linux version of netstat can provide the same information using its -p option, and Windows XP Service Pack 2 can provide the same with the b option.) For example, here's the output of lsof running on a Linux machine: # lsof -i -n -V -P COMMAND PID USER FD TYPE DEVICE SIZE NODE NAME portmap 1209 root 3u IPv4 18068 UDP *:111 portmap 1209 root 4u IPv4 18069 TCP *:111 (LISTEN) rpc.statd 1264 root 4u IPv4 18120 UDP *:1016 rpc.statd 1264 root 5u IPv4 18143 UDP *:32768 rpc.statd 1264 root 6u IPv4 18146 TCP *:32768 (LISTEN) ntpd 1401 root 4u IPv4 18595 UDP *:123 ntpd 1401 root 5u IPv4 18596 UDP 127.0.0.1:123 ntpd 1401 root 6u IPv4 18597 UDP 129.174.142.77:123 X 2290 root 1u IPv4 23042 TCP *:6000 (LISTEN) sshd 7005 root 3u IPv4 143123 TCP *:22 (LISTEN) The lsof utility, by name, lists all the open files on a system. (As you might have guessed, lsof stands for list open files.) With the i command-line switch appended, lsof lists only open files of the type IP (version 4 or 6), which basically give us a list of files that are running IP processes. The n option removes the listing of hostnames, and the V option guarantees a verbose output. P is used to force lsof to display port numbers, rather than the popular service name for the port in question. The result of the command is a list of running programs that have a TCP or UDP port open. Listings with (LISTEN) following them are actually accepting traffic on the port in question. Anyone who has ever tried to figure out whether a backdoor service is installed on his machine can recognize the value in this! Of course, lsof won't magically find a backdoor if the attacker has taken advanced steps to hide it, such as replacing the lsof utility with a Trojan version or installing a cloaking kernel module. Fport and Active PortsFoundstone's Fport, available at http://www.foundstone.com, is a tool for Windows NT and higher that reports open TCP and UDP ports and maps them to the owning process, similarly to lsof. Listing 21.1 shows the output from running Fport on a Windows 2000 machine (edited slightly to shorten the length of a couple lines). Listing 21.1. Running Fport on Windows 2000C:\>fport FPort v1.33 - TCP/IP Process to Port Mapper Copyright 2000 by Foundstone, Inc. http://www.foundstone.com Pid Process Port Proto Path 392 svchost -> 135 TCP C:\WINNT\system32\svchost.exe 8 System -> 139 TCP 8 System -> 445 TCP 588 MSTask -> 1025 TCP C:\WINNT\system32\MSTask.exe 8 System -> 1031 TCP 8 System -> 1033 TCP 920 mozilla -> 1090 TCP ...\Mozilla\mozilla.exe 920 mozilla -> 1091 TCP ...\Mozilla\mozilla.exe 420 spoolsv -> 1283 TCP C:\WINNT\system32\spoolsv.exe 392 svchost -> 135 UDP C:\WINNT\system32\svchost.exe 8 System -> 137 UDP 8 System -> 138 UDP 8 System -> 445 UDP 220 lsass -> 500 UDP C:\WINNT\system32\lsass.exe 208 services -> 1027 UDP C:\WINNT\system32\services.exe 872 MsFgSys -> 38037 UDP C:\WINNT\System32\MsgSys.EXE You can see a number of NetBIOS and other services running on the machine. You might consider eliminating some of them if you're hardening the system. You can also use Fport when you're investigating a possible break-in or verifying that a service is running. The Active Ports freeware program offers similar functionality on Windows NT and higher platforms and is available from SmartLine's website at http://www.protect-me.com/freeware.htm. Using a user-friendly GUI, Active Ports displays the program name that is running, its PID, the local and remote IP and port using the process, whether it is listening, the protocol it is running on, and the path where the file can be located (see Figure 21.1). Figure 21.1. The Active Ports tool from Smartline offers similar functionality to lsof and Fport for Windows through an easy-to-read GUI interface.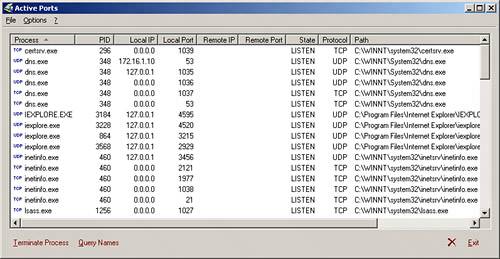 By clicking the Query Names button, you can translate IP addresses to their associated DNS names. Another very useful feature of Active Ports is its ability to terminate any of the listed processes. Simply select any of the listed processes with a single mouse click and click the Terminate Process button. If it is possible, the process will be shut down. This does not guarantee the process will not restart the next time you reboot the system, but it does allow for an easy way to shut down currently running processes when you're troubleshooting. HpingThe UNIX program hping has several capabilities, some of which we will touch on later in this chapter. With hping, you can generate almost any type of packet you can imagine, allowing you to choose the protocol, source and destination addresses, ports, flags, and what options are set in packets that you want to send to a target host. Note For similar functionality for Windows systems, download PacketCrafter from http://www.komodia.com/tools.htm. Though not quite as feature rich as hping, it does offer many of the same packet-constructing capabilities in a Windows freeware package, with an easy-to-use GUI interface. You can generate a packet with the SYN flag set and send it to a target host to determine whether a TCP port is open on that system, as shown in Listing 21.2. Listing 21.2. Checking Firewall TCP Rules with Hping SYN Packets# hping --count 1 --syn --destport 80 www.extdom.org eth0 default routing interface selected (according to /proc) HPING www.extdom.org (eth0 192.168.2.100): S set, 40 headers + 0 data bytes 46 bytes from 192.168.2.100: flags=SA seq=0 ttl=53 id=24080 win=16384 rtt=17.0 ms --- www.extdom.org hping statistic --- 1 packets transmitted, 1 packets received, 0% packet loss round-trip min/avg/max = 24.8/24.8/24.8 ms # hping --count 1 --syn --destport 443 www.extdom.org eth0 default routing interface selected (according to /proc) HPING www.extdom.org (eth0 192.168.2.100): S set, 40 headers + 0 data bytes 46 bytes from 192.168.2.100: flags=RA seq=0 ttl=53 id=42810 win=0 rtt=20.2 ms --- www.extdom.org hping statistic --- 1 packets transmitted, 1 packets received, 0% packet loss round-trip min/avg/max = 20.2/20.2/20.2 ms We sent a SYN packet to port 80. We can see that HTTP is open because the server returns a SYN+ACK (flags=SA). However, a similar packet that was sent to port 443 returns an RST+ACK (flags=RA) packet, which means that HTTPS is not open. Note Although it doesn't show it, hping sends an RST packet when it receives a SYN+ACK response. That way, we can't accidentally cause a SYN flood denial of service! Hping's control over individual flags makes it particularly useful for testing firewall filtering capabilities and configuration. Consider the following output, where we send two SYN packets to a randomly chosen destination port: # hping count 2 --syn --destport 3243 www.extom.org eth0 default routing interface selected (according to /proc) HPING www.extom.org (eth0 192.168.2.100): S set, 40 headers + 0 data bytes --- www.extom.org hping statistic --- 2 packets transmitted, 0 packets received, 100% packet loss round-trip min/avg/max = 0.0/0.0/0.0 ms We don't receive responses to the SYN packets, so we know the firewall silently drops disallowed traffic. We can verify that by looking at the firewall logs. Now look at the results in Listing 21.3, where we send ACK packets instead of SYN packets. Listing 21.3. Checking Firewall TCP Rules with Hping ACK Packets# hping count 2 --ack --destport 3243 www.extom.org eth0 default routing interface selected (according to /proc) HPING www.extom.org (eth0 192.168.2.100): A set, 40 headers + 0 data bytes 46 bytes from 192.168.2.100: flags=R seq=0 ttl=53 id=8060 win=0 rtt=17.1 ms 46 bytes from 192.168.2.100: flags=R seq=0 ttl=53 id=2472 win=0 rtt=17.3 ms --- www.extom.org hping statistic --- 2 packets transmitted, 2 packets received, 0% packet loss round-trip min/avg/max = 17.1/17.1/17.1 ms The firewall allows ACK packets to come through! This firewall most likely does not support stateful filtering and is configured to allow outbound TCP connections; otherwise, this simulated response packet would have been silently dropped like the SYN flagged packet was. Allowing unsolicited ACK packets can be exploited as a reconnaissance method or as a means to successfully mount a denial of service (DoS) attack. TcpdumpTcpdump is one of the most commonly used sniffer programs; it has many uses, including diagnosing transport layer issues. We have used Tcpdump throughout this book to look at network traffic. This freeware program came out of the BSD environment and has been ported to other platforms, including Linux, Solaris, and Windows. It is a critical component for debugging almost any network problem, and many experienced troubleshooters begin with it unless they're obviously not dealing with a network problem.
You will probably run Tcpdump often as you realize the power it gives you. The ability to see whether traffic is even being transmitted is often enough to solve a problem or at least isolate it. For example, suppose a client at a small company is complaining that he is unable to connect to websites on the Internet. You watch him attempt a connection and, sure enough, his Internet Explorer just hangs whenever he types in a URL. Many factorsDNS issues, a routing problem, or problems with the websitecould cause this behavior. You could spend a lot of time working through this list, or you can fire up a laptop and run Tcpdump.
In this case, you might see something like the following when the user tries to access http://www.yahoo.com (the ellipses indicate where we truncated the long lines): # tcpdump -i eth0 -n host 192.168.11.88 and tcp port 80 tcpdump: listening on eth0 17:59:26.390890 192.168.11.88.33130 > 64.58.77.195.80: S ... 17:59:29.385734 192.168.11.88.33130 > 64.58.77.195.80: S ... 17:59:35.385368 192.168.11.88.33130 > 64.58.77.195.80: S ... Now we know that the user's machine is transmitting the SYN packets successfully (which means that it already has successfully queried DNS for the remote IP address), but it isn't receiving responses. We now hypothesize that something is filtering the responses, so we pursue that by connecting the laptop outside the border router. Now Tcpdump prints something like the following: # tcpdump -i eth0 -n tcp port 80 tcpdump: listening on eth0 18:28:10.964249 external_if.53153 > 64.58.77.195.80: S ... 18:28:10.985383 64.58.77.195.80 > external_if.53153: S ... ack ... 18:28:10.991414 external_if.53162 > 64.56.177.94.80: S ... 18:28:11.159151 64.56.177.94.80 > external_if.53162: S ... ack ... The router is performing Network Address Translation (NAT), so external_if represents the router's external IP address. The remote site is responding, but the SYN+ACK responses aren't making it through the router; otherwise, we would have seen some in the previous output. This is indicative of a filtering problem on the router. You might hypothesize that someone modified the ACLs incorrectly, and you could test your theory by looking at the router configuration. Imagine how long we might have spent isolating this problem without Tcpdump! Revisiting the Sample Firewall Problem with Transport Layer TechniquesWe have verified that something is blocking the HTTP traffic over our dial-up laptop connection to the web server because we installed a new firewall. We wonder whether the traffic is even making it to the firewall. We run Tcpdump on the web server and see no HTTP traffic. We run Tcpdump on another machine that is connected to an external network outside of our firewall and see the remote Internet user's SYN packets addressed to the web server coming into the network; however, we don't see response packets coming back from the web server. Now we wonder if the firewall is blocking HTTP traffic, despite what we found in our earlier examination of its configuration and logs. From the external machine, we Telnet to port 80 on the web server and discover that it works fine. Therefore, the firewall is not blocking HTTP from the external machine. However, the firewall doesn't seem to receive HTTP packets from the Internet at all; we would see log messages if they were blocked, and we would see response packets from the server if they weren't blocked. Network Layer TroubleshootingSecurity device problems at the network layer usually fall into one of the following categories:
We will show you some tools to help troubleshoot problems in each of these areas.
You have already seen some of the tools we present at this layer, but here we show how to use them for network layer problems. Some display information on the host, and some test network connectivity. Many have multiple uses and were introduced earlier. Ifconfig and IpconfigBoth ifconfig and ipconfig utilities display host information that helps you verify that the IP address, subnet mask, and broadcast address are configured correctly. There's nothing magic here, but it's probably one of the things you'll check most often. The UNIX ifconfig utility configures network interfaces and displays network interface details. Use the -a option to display all interfaces when you don't know the name of the interface you're trying to look at. The -v option might show additional information, such as the speed and duplex of the interface, as in the following display from an SGI IRIX box: # ifconfig -av ef0: flags=415c43<UP,BROADCAST,RUNNING,FILTMULTI,MULTICAST, ¬CKSUM,DRVRLOCK,LINK0,IPALIAS> inet 192.168.114.50 netmask 0xffffff00 broadcast 192.168.114.255 speed 100.00 Mbit/s full-duplex lo0: flags=1849<UP,LOOPBACK,RUNNING,MULTICAST,CKSUM> inet 127.0.0.1 netmask 0xff000000 The ipconfig utility for Windows NT and higher primarily displays IP configuration information, although you can also use it to release and renew DHCP configurations. Use the -all option to print the IP address, subnet mask, and broadcast address of each interface. The ipconfig all command also displays the IP addresses of the DNS servers and, if applicable, the DHCP and WINS servers that are configured on the host. Windows 9x users also have access to ipconfig's functionality via the winipcfg GUI program. Listing 21.4 shows the type of information you get from ipconfig. Listing 21.4. Sample Ipconfig OutputC:\> ipconfig -all Windows IP Configuration Host Name . . . . . . . . . : TELLUS.intdom.org DNS Servers . . . . . . . . : 192.168.111.2 Node Type . . . . . . . . . : Broadcast NetBIOS Scope ID. . . . . . : IP Routing Enabled. . . . . : No WINS Proxy Enabled. . . . . : No NetBIOS Resolution Uses DNS : Yes 0 Ethernet adapter : Description . . . . . . . . : Novell 2000 Adapter. Physical Address. . . . . . : 18-18-A8-72-58-00 DHCP Enabled. . . . . . . . : Yes IP Address. . . . . . . . . : 192.168.111.130 Subnet Mask . . . . . . . . : 255.255.255.0 Default Gateway . . . . . . : 192.168.111.1 DHCP Server . . . . . . . . : 192.168.111.1 Primary WINS Server . . . . : Secondary WINS Server . . . : Lease Obtained. . . . . . . : 12 19 01 4:09:39 PM Lease Expires . . . . . . . : 12 20 01 4:09:39 AM From a security device troubleshooting perspective, you will most often focus on a few items in this output. The DNS server IP address in the Configuration section can help you diagnose some application layer problems. The IP address and default gateway addresses, in the Ethernet Adapter section, are useful for routing or other connectivity problems. The DHCP server and lease information might also be useful for troubleshooting connectivity problems. The other lines might be of interest for troubleshooting Windows domain or workgroup issues, such as file sharing or network neighborhood problems. NetstatAs we mentioned in the section "Transport Layer Troubleshooting," the netstat utility exists in all UNIX and Windows distributions. Its -r option can be used for network layer troubleshooting to display the host routing table. Note You can also get this information on a Windows system via the route print command or on a UNIX system using the route command. Most of the time we're looking for the default gateway, which is displayed with a destination IP and subnet mask of 0.0.0.0. The following Linux output shows two networks, 10.0.0.0 and 129.174.142.0, accessible through the vmnet1 and eth0 interfaces, respectively. Both are class Csized, with a subnet mask of 255.255.255.0. The default gateway is 129.174.142.1. Almost all TCP/IP devices include a loopback interface, named lo in this case, serving network 127.0.0.0: $ netstat -rn Kernel IP routing table Destination Gateway Genmask Flags Iface 10.0.0.0 0.0.0.0 255.255.255.0 U vmnet1 129.174.142.0 0.0.0.0 255.255.255.0 U eth0 127.0.0.0 0.0.0.0 255.0.0.0 U lo 0.0.0.0 129.174.142.1 0.0.0.0 UG eth0 When troubleshooting network layer issues, you will usually focus on the default gateway line in netstat output. Many routing problems are caused by missing or incorrect gateway entries in the routing table. Every TCP/IP device, unless you're working on a standalone LAN or a core Internet router, should have at least a default gateway entry. The routing tables can become large when you're running a routing protocol, such as the Routing Information Protocol (RIP), on your network. However, routing updates are automatic in such environments, which could eliminate the need to troubleshoot routing information with netstat. PingThe venerable ping utility, which is included in all UNIX and Windows distributions, employs the Internet Control Message Protocol (ICMP) to test whether a remote host is reachable. It sends an ICMP echo request packet and listens for the ICMP echo reply from the remote host. This is a great test of end-to-end connectivity at the network layer; however, unfortunately today most firewalls block ICMP. The protocol has been used one too many times in ICMP flood and other attacks. If you want to test end-to-end connectivity, you might have to move up a layer and use the hping or Telnet utility, described in the section "Transport Layer Troubleshooting." TracerouteTraceroute is another classic utility that is available on all UNIX and Windows machines, although the command is abbreviated as tracert in Windows. It manipulates the IP header time-to-live (TTL) field to coerce the gateways between your machine and the destination into sending back ICMP messages. Each gateway decrements the TTL and, if it's zero, returns an ICMP time-exceeded message to the sender. By starting with a TTL of 1 and incrementing it, traceroute detects the IP address of each router along the way by examining the source addresses of the time-exceeded messages. Traceroute also inserts a timestamp in each packet so that it can compute the roundtrip time, in milliseconds, when it gets a response. This is possible because the ICMP response messages include the original packet in their payloads. These capabilities make traceroute an excellent tool to help determine where traffic fails as it traverses the Internet. Traceroute is also useful in diagnosing performance problems. If you see the route change frequently, you might hypothesize that you have a route-flapping problem somewhere. Unfortunately, proving that might be impossible because the loci of such problems are usually on the Internet, outside of your jurisdiction. By default, UNIX traceroute sends a UDP datagram to a high-numbered port on the destination. The port is almost always closed on the destination. Therefore, an ICMP port-unreachable message is sent back when a packet finally makes it all the way, which tells traceroute when to stop. Unfortunately, this won't work when your firewall blocks the outbound UDP packets or when the high port is actually open on the destination (in which case it will probably be discarded, with no response). Traceroute also breaks when the target organization blocks inbound UDP (for UNIX traceroute) or inbound ICMP (for Windows trace-route). Windows uses ICMP echo request packets instead of UDP. Many UNIX distributions now support the -I option to use ICMP instead of UDP. Of course, traceroute also won't work if your firewall blocks outbound UDP or ICMP echo request messages (as the case may be) or inbound ICMP time-exceeded messages. One way to overcome these issues is by using hping. The hping command includes --ttl and --TRaceroute options to specify a starting TTL value, which is incremented like the actual traceroute command. Applying these options to an HTTP SYN packet, for example, will get the outbound packets through your firewall. However, if your firewall blocks inbound ICMP, you will never see the time-exceeded messages sent back by external gateways. The output in Listing 21.5 shows a typical traceroute. You can see that three packets are sent for each TTL value. No packets were lost in this example (we don't see any * values in place of the roundtrip times), and all response times appear to be reasonable, so we don't see performance problems on this route. Listing 21.5. Sample Traceroute Output# traceroute -n www.yahoo.com traceroute: Warning: www.yahoo.com has multiple addresses; using 64.58.76.224 traceroute to www.yahoo.akadns.net (64.58.76.224), 30 hops max, 38 byte packets 1 63.212.11.177 0.675 ms 0.474 ms 0.489 ms 2 63.212.11.161 1.848 ms 1.640 ms 1.636 ms 3 172.20.0.1 26.460 ms 17.865 ms 40.310 ms 4 63.212.0.81 24.412 ms 24.835 ms 24.488 ms 5 198.32.187.119 33.586 ms 26.997 ms 26.715 ms 6 216.109.66.4 33.570 ms 26.690 ms 27.066 ms 7 209.185.9.1 33.576 ms 26.932 ms 26.811 ms 8 216.33.96.161 20.107 ms 20.097 ms 20.181 ms 9 216.33.98.18 24.637 ms 26.843 ms 26.901 ms 10 216.35.210.122 35.771 ms 28.881 ms 27.052 ms 11 64.58.76.224 33.452 ms 26.696 ms 27.020 ms TcpdumpWe have to include Tcpdump at this layer, at least to help debug VPN problems. The latest versions print a lot of useful information about the Internet Key Exchange (IKE) service (UDP port 500), which establishes and maintains IPSec authentication and encryption keys. Tcpdump also prints some information about the IPSec Encapsulation Security Payload (ESP) and Authentication Header (AH) protocolsIP protocols 50 and 51, respectively (these are protocol numbers, not port numbers). If you have users who are unable to establish an IPSec tunnel with a device that you are administering, you could successfully troubleshoot possible issues by tracing the traffic arriving at the device in question with Tcpdump. You can verify that IKE exchanges are occurring correctly and that the proper ESP traffic is getting to the device in question. This is especially helpful because IPSec lacks good logging facilities of its own. As you might have noticed by now, Tcpdump is one of our favorite tools. It can put you on a fast track to solving almost any network problem, and many experienced troubleshooters will go straight to it rather than trying to understand all the problem symptoms, eyeball configuration files, and so on.
We have presented a few tools for network layer troubleshooting and have provided a few examples of their use. NAT and VPN problems probably represent the bulk of the problems you're likely to deal with in this layer. Next, we will move down to the bottom of the TCP/IP reference model: the link layer. Link Layer TroubleshootingThis layer can present you with some of your toughest problems. These problems will be a lot easier to solve if you master a couple key topics:
ARP is the link layer protocol that TCP/IP devices use to match another device's Media Access Control (MAC) address with its IP address. MAC addresses, not IP addresses, are used to communicate with other devices on the same network segment. When a device determines that a given IP address resides on the same segment that it does (by examining the address and its own subnet mask), the device uses ARP to discover the associated MAC address. Basically, the device sends a link-level broadcast asking who has the IP address. Every device on the segment examines the request, and the one that uses the enclosed IP address responds. The original device stores the source MAC address of the response in its ARP table; that way, subsequent transmissions don't require the broadcast process. ARP table entries eventually expire, which necessitates periodic rebroadcasts. This ARP table expiration is necessary to facilitate the moving of IP addresses between devices (for example, DHCP) without the manual reconfiguration of all the other devices on the network segment. In a nonswitched network, a network segment usually maps directly to the physical network medium. In a switched network, a network segment's boundaries become a little vague because the switches might be configured to break the physical network into logical segments at the link layer. In general, the set of devices that can see each others' ARP broadcasts delineates a network segment. You can find out more about these topics and their security ramifications in Chapter 13 and on the Internet at http://www.sans.org/resources/idfaq/switched_network.php. With an understanding of these subjects under your belt, all you need are a couple tools to diagnose almost any problem at the link layer. You will find link layer tools are similar to those used at the other network layers. Most of them display host information. Once again, you will find Tcpdump useful for displaying what's happening on the network, this time at Layer 2. Ifconfig and IpconfigWe already covered these tools in the "Network Layer Troubleshooting" section, but you might not have noticed that they can also display the MAC address associated with the link layer. Look back at the ipconfig -all output and you will see the MAC address displayed as the Physical address. On UNIX machines, the method for determining the address varies greatly. On Linux and FreeBSD machines, ifconfig shows the address by default, as seen in the following Linux output, as the HWaddr: # ifconfig eth0 eth0 Link encap:Ethernet HWaddr 00:10:5A:26:FD:41 ... Try one of the following methods to display the MAC address for your system:2
ARPThe arp utility, naturally, displays information that pertains to the ARP protocol and ARP table. It exists in all UNIX and Windows distributions, and it is most often executed with the -a option to display the ARP table, as follows: # arp -a ? (123.123.123.123) at 00:02:E3:09:D1:08 [ether] on eth0 ? (192.168.126.88) at 00:D0:09:DE:FE:81 [ether] PERM on eth0 ? (192.168.126.130) at 00:D0:09:DE:FE:81 [ether] on eth0 ? (192.168.126.127) at 00:10:4B:F6:F5:CE [ether] PERM on eth0 ? (192.168.126.1) at 00:A0:CC:7B:9C:21 [ether] PERM on eth0 You can glean a lot of information from this table, in which ARP stores its IP/MAC pairs. It shows static entries (tagged with PERM) that were added manually with the arps option. These can help mitigate vulnerability to some devastating link layer attacks. The ARP protocol discovered the other entries and added them dynamically. You can also see that two logical networks are accessed via the eth0 interface and that this is probably a Linux box, given the interface name. In case the other methods we showed you to determine your MAC address failed, you can always use SSH to connect to another machine on the same LAN to see your own MAC address. Note Windows NT and 9x versions have trouble maintaining static ARP entries (see http://www.securityfocus.com/bid/1406). For a quick introduction to ARP and link layer attacks, such as ARP spoofing, refer to Chapter 13. If your system can't connect to a host outside your local network segment, try pinging your default gateway's IP address (not its hostname) and then looking at your ARP table. If you don't see your gateway's MAC address, you probably have a link layer problem. Otherwise, the problem is at a higher layer. You can also apply this same logic on your gateway device. Check the ARP table on it to see what entry it contains for your source system. An incorrect, sticky, or static ARP entry could be the source of your problem. If no ARP entry is found in the table, you are most likely facing a physical layer issue (network card or cabling). When troubleshooting connectivity issues between devices on the same network segment, ping the device you cannot connect to and check your ARP table to see if you receive an entry for the IP address you are trying to ping. If you do not, you have a link or physical layer issue, such as a stale ARP table entry on another host, a bad network card, bad cabling, or the like. If you do receive an ARP entry, you are most likely fighting a Layer 3 or above filtering issue, such as port filtering, a host-based firewall, or a restrictive IPSec policy on the target system. TcpdumpIt's no surprise that we use Tcpdump at this layer, too! Tcpdump can help debug some insidious problems. For example, consider a workstation that can't access the Internet, although other workstations on the same hub have no trouble. We can ping the other workstations, but we can't ping the gateway router. If we run Tcpdump and ping the router again, we see the following: # tcpdump -n host 192.168.1.130 12:17:56.782702 192.168.1.130 > 192.168.1.1: icmp: echo request 12:17:56.783309 192.168.1.1 > 192.168.1.130: icmp: echo reply 12:17:57.805290 192.168.1.130 > 192.168.1.1: icmp: echo request 12:17:57.805823 192.168.1.1 > 192.168.1.130: icmp: echo reply The router (192.168.1.1) is actually replying to our pings! We try running Tcpdump again, this time with the -e switch to print the MAC addresses:
Note the source MAC address on the echo request our machine sent and the destination MAC address on the reply the router sent. They don't match. We check the router configuration and find an old static ARP entry in its cache. Deleting the entry fixes the problem. Revisiting the Sample Firewall Problem with Link Layer TechniquesIf you read the previous Tcpdump example, you're probably close to solving the sample firewall problem we have highlighted throughout this chapter. We have successfully accessed the web server from a workstation that is connected just outside the firewall, so the firewall rules are most likely correct. However, we still cannot access the web server from the Internet. A border router separates us from the Internet. Also, recall that the firewall was replaced with a new machine just before the problems started. We execute tcpdump en to look at the MAC addresses, and we discover that the router is sending HTTP traffic to the wrong MAC address for the firewall. We check the router configuration, discover a static ARP entry for the old firewall machine, and change the entry to fix the problem. |
|
EAN: 2147483647
Pages: 230