Quantitative risk analysis
|

|
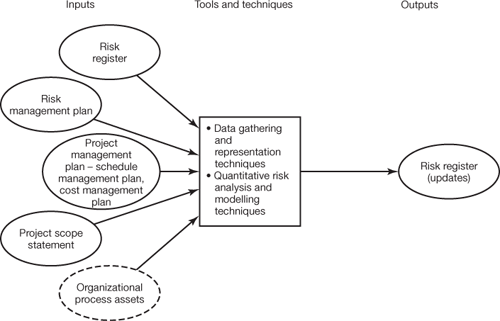
Once the risks have been prioritized and listed by the qualitative risk analysis process, the next stage can involve analyzing the risks and assigning a numerical rating on the probability and impact of the highest risks. The process is illustrated in Figure 11.4. Quantitative risk analysis can also be used to present a quantitative approach when having to make decisions regarding the project, as well as determining which risks warrant a response. It is worth carrying out this process only if the time and cost warrant this level of effort, because there is little point in completing this analysis for a short-term project or risks of a lower priority. For projects where a quantitative approach is essential, there is no need to conduct qualitative risk analysis and the team therefore jumps straight into the quantitative risk analysis. The analysis will generally involve all or some of the following activities:
Figure 11.4. The quantitative risk analysis processThis process is the final logical step in understanding risks to follow from identification of risks. The point of quantification is to understand the size of risks and their probability. This enables management to make an informed judgement on how to prioritize risks and how to manage them. Without quantification risk management is essentially guesswork. Risks need to be quantified, where it is feasible to do so. The temptation to try to quantify the unquantifiable should be resisted, as not only does it waste time, but it creates a false sense of security. Adapted from PMBOK Guide (p.254)
Many of the same information gathering techniques, such as interviewing, the Delphi technique and expert judgement used in risk identification, can also be applied for quantitative risk analysis. Other ways to determine the probability and impact of the risks can come from the use of historical records, expected monetary value analysis, Monte Carlo analysis, and cost and time estimating. Expected monetary value (EMV)This tool is a statistical concept that calculates the average outcome when the future includes scenarios that may or may not occur. In simple terms it is the percentage probability multiplied by the value of the impact if it did occur. Table 11.3 shows an example.
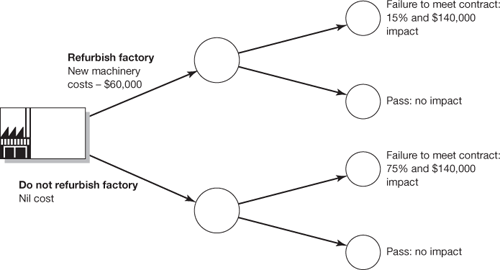
This type of analysis is commonly used in decision tree analysis (see below). A positive EMV is an opportunity value, but a risk is expressed as a negative EMV. Monte Carlo analysisThis type of analysis uses the network diagram and estimates to conduct a series of simulations on cost and schedule for the project. It is able to evaluate the overall risk in the project and provides a percentage value that it will be finished by a certain date, or within a specified cost. The simulation can also be used to determine the probability of any activity being on the critical path and to take path convergence into account. The series of complex iterations is normally conducted using a computer-based Monte Carlo program, with the results displayed in a probability distribution form. Decision treeDecision trees are used to make decisions about individual risks when there is an element of uncertainty. A decision tree tries to take future events into account when making a decision today. If you are unsure about any decisions, this technique could be used to assist the decision-making process by considering all the implications of each choice. Solving the decision tree provides the EMV for each alternative when all the benefits and subsequent decisions are quantified. As an example, Company X is considering whether to refurbish an old factory, or to continue running on its existing facility due to the launch of a new product. Figure 11.5 shows the calculated impacts when determining whether the plant works or fails for the production of the new item. It shows that if the refurbishment costs are looked at in isolation, the decision to spend money on the old plant would seem unwise. However, taking just one future event into account, the decision to refurbish the old factory to produce the new item could work out cheaper. Figure 11.5. Decision tree for a factory refurbishment
Output of quantitative risk analysis risk register updatesDuring the risk identification process the risk register is raised, but it should be updated in response to both the qualitative and quantitative risk analysis. The updates to the risk register should revise the priority list of quantified risks, together with the amount of contingency and reserves needed to accommodate the risks on the project. Other elements to update may include the realistic and proposed completion dates and project costs versus the time and cost objectives for the project. An update may also alter the quantified probability of meeting the overall project requirements and objectives. |
|
Top of Page